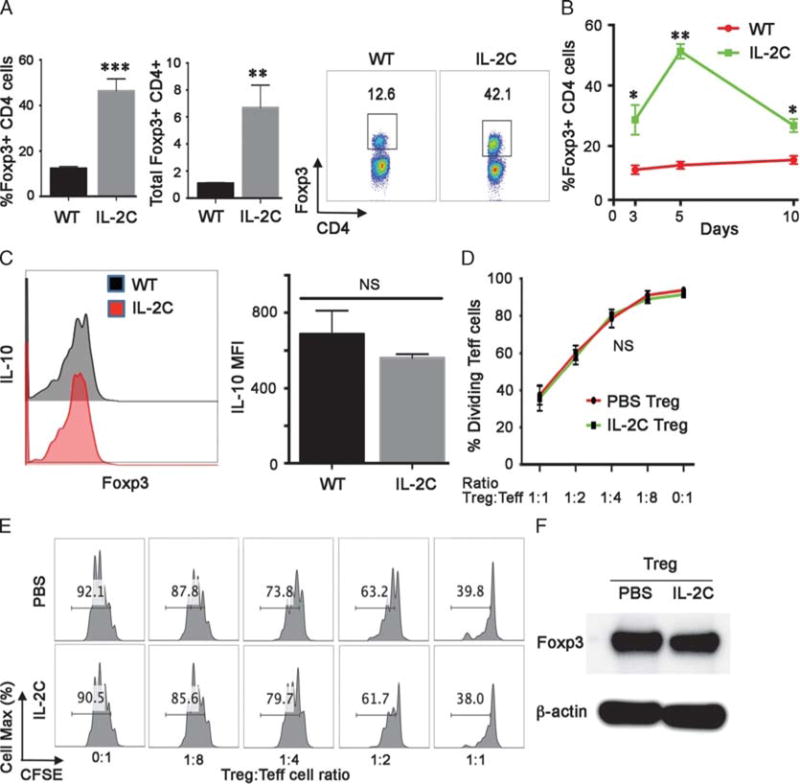
FIGURE 1.

IL-2C administration increases Treg cell numbers. A, IL-2C significantly increases the percentage of Foxp3+ Treg cells within the splenic CD4+ T fraction, and total Foxp3+ Treg cell numbers (106 cells/spleen); data (mean ± SD) are from 4 animals/group/time-point, **P < 0.01, ***P < 0.005. A representative flow plot is shown at right with the percentage of Foxp3 + CD4+ Treg cells indicated. B, IL-2C administration on days 0, 1 and 2 led to a peak in the percentage of Foxp3 + CD4+ Treg cells on day 5, with a decline thereafter towards baseline; data (mean ± SD) are from 4 animals/group/time-point, *P < 0.05, **P < 0.01. C, IL-2C administration did not affect expression of IL-10 by Treg cells harvested at 5 days after beginning IL-2C therapy; a representative flow plot is shown at left, and cumulative MFI data (mean ± SD, n = 4/group, NS, not significant) are shown at right. D, IL-2C administration did not affect Treg cell suppressive function as assessed by in vitro assays (mean ± SD, n = 4/group) using cells analyzed at day 5. E, An in vitro suppression assay, representative of 4 studies, with the proportion of dividing T effector cells shown in each panel. E, Western blots of Foxp3 protein expression in Treg cells isolated from mice treated with IL-2C or PBS (representative of 3 experiments). MFI, mean fluorescent intensity.
