
FIGURE 3.
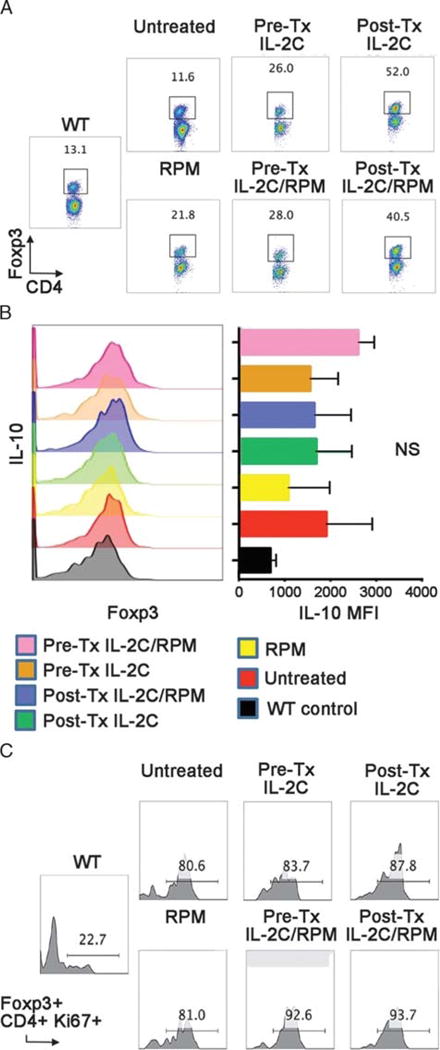
Comparison of Treg cell populations at day 5 post-Tx (4 mice/group). A, Percentages of Foxp3+ cells within the CD4+ Tcells of Tx groups and WT mice are shown. B, Treg cell intracellular expression of IL-10, as determined by flow cytometry (MFI), did not significantly differ across groups. C, The percentages of proliferating (Ki67+) Foxp3+ CD4+ Treg cells were comparable across groups but markedly increased compared with untransplanted WT control mice.