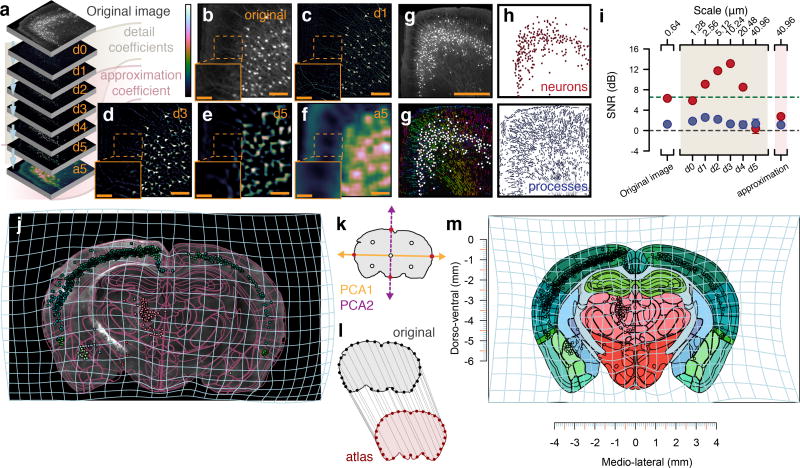
Figure 3. Method for segmentation and registration.
(a) Wavelet multiresolution decomposition. (b) Original image tile. (c) Detail coefficients d1 at a scale period of 1.28 µm. (d) Coefficients at d3 with scale period 10.24 µm. (e) Coefficients at d5 with scale period 40.96 µm. (f) Approximation coefficients. (g) Top: original 16-bit image tile. Bottom: segmented processes with their direction color-coded by hue as well as cell bodies as white circles. Scale bar: 500 µm (h) Top: segmentation result separated into cell bodies. Bottom: segmented process. (i) Comparison of binary segmentation on different detail coefficients to a human annotator (n = 273 cell bodies), red: cell bodies, blue: processes, gray horizontal line: SNR of 1:1, green dashed line: Rose criteria SNR 5:1 [33]. Error bars: 95% confidence intervals around the mean. (j) Image section of rabies-EGFP targeted to dorsal striatum in D2-Cre mouse, purple lines: transformed reference atlas, light blue grid: backward warp transform from atlas to original image. (k) Segmentation of brains section based on autofluorescence (vertical purple line). Pink shaded area indicates range of fluorescent intensity where cell bodies can be found. (l) Correspondence generation by principal components, red dots: intersection with contour, white dots: midpoints. (m) 32 correspondence points between original contour, gray, and reference atlas, red. (n) Forward warp transform, light blue, of segmentation output into stereotactic space.

