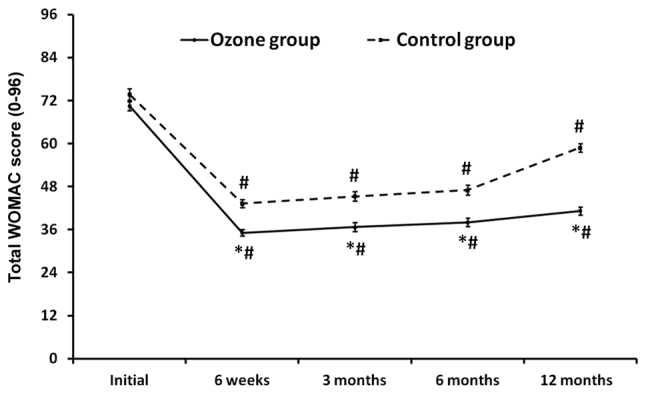
Figure 4.

Total WOMAC scores in the groups pre- and post-treatment. *P<0.05 vs. control group; #P<0.05 vs. baseline. WOMAC, Western Ontario and McMaster Universities Osteoarthritis Index.

Total WOMAC scores in the groups pre- and post-treatment. *P<0.05 vs. control group; #P<0.05 vs. baseline. WOMAC, Western Ontario and McMaster Universities Osteoarthritis Index.