. 2018 May 23;54(47):5988–5991. doi: 10.1039/c8cc01388h

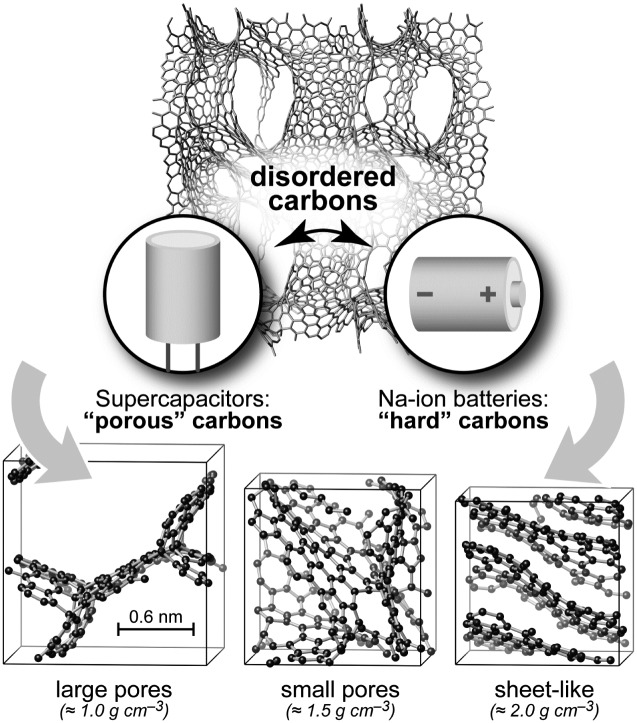
Fig. 1. Structural models of disordered carbons and their most relevant applications. Top: Example 930-atom structure (≈1 g cm–3), created in a long GAP-driven MD simulation. A 2 × 2 × 1 simulation-box expansion is shown to make the pore structure more visible. Bottom: Smaller structural models, containing ≈200 atoms, drawn using VESTA.21 On the left, a scale bar shows the experimentally determined average pore diameter in TiC-CDC-600 samples (see below); larger pore sizes are seen experimentally in samples prepared at higher temperature.22 These figures provide only three examples of the pore structures generated in this work and a more detailed discussion of pore sizes is provided in the ESI. .

Fig. 1