FIGURE 3:
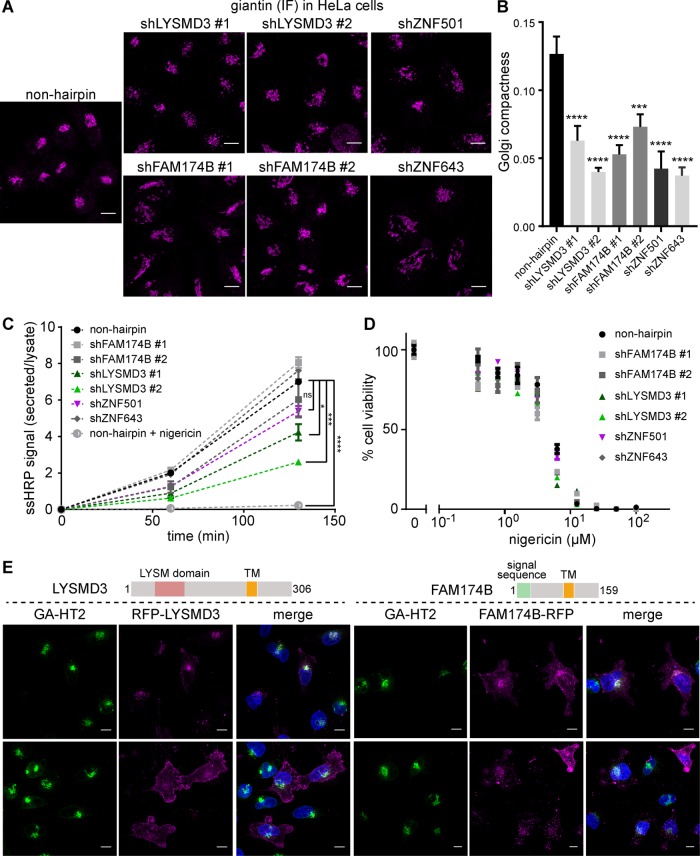
Novel Golgi stress genes are involved in Golgi integrity and secretion. (A) Representative giantin immunofluorescence images of HeLa cells expressing the indicated shRNAs (maximum projections of z-stacks; scale bar: 10 µm). (B) Quantitation of Golgi fragmentation depicted in A. Non-hairpin: 16 cells; shLYSMD3 #1: 13 cells; #2: 16 cells; shFAM174B #1: 20 cells; #2: 21 cells; shZNF501: 14 cells; shZNF643: 13 cells; all data represent mean ± SEM. ***, p < 0.001, ****, p < 0.0001 (one-way analysis of variance [ANOVA] with Tukey’s multiple comparison). (C) Secretion of ssHRP over time in HeLa cells expressing the indicated shRNAs as measured by an HRP assay. Treatment with 2 µM nigericin was carried out 3 h before beginning the measurements. Data represent mean ± SEM (n = 2). *, p < 0.05; ***, p < 0.001; ****, p < 0.0001 (one-way ANOVA with Sidak’s multiple comparison). (D) Nigericin dose response measuring cell viability by CellTiter-Glo 17 h after treatment of HeLa cells expressing the indicated shRNAs. (E) Confocal microscopy images showing the localization of the indicated RFP fusion proteins (magenta) in HeLa cells expressing GA-HT2 (green). Nuclei are visualized with DAPI (blue). Top row shows low expression level and bottom row high expression level of the RFP fusion proteins (maximum projections of z-stacks; scale bar: 10 µm).

