FIGURE 4:
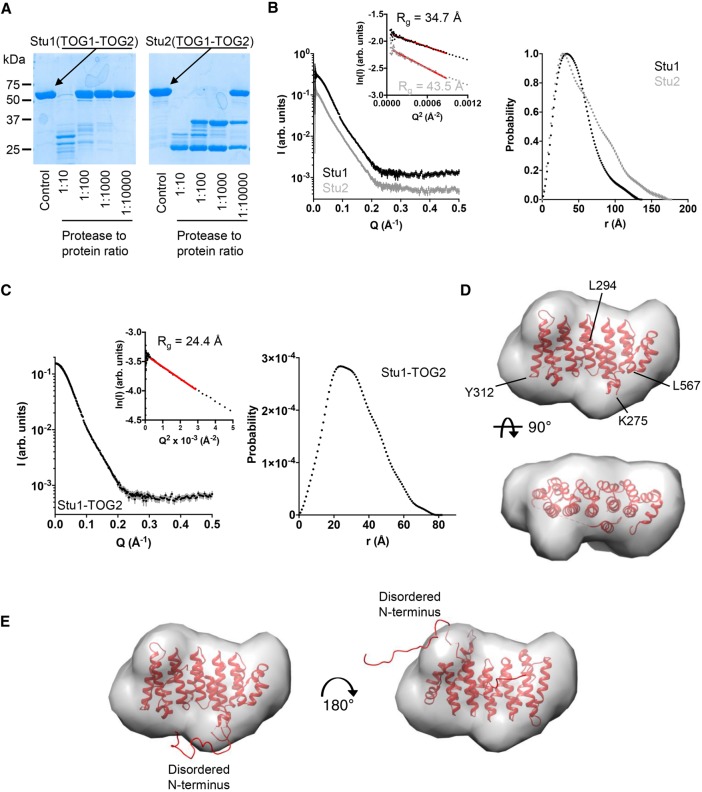
Solution analysis of TOG1-TOG2 and TOG2 fragments. (A) Limited chymotrypsin proteolysis of TOG1-TOG2 fragments from Stu1 (left) and Stu2 (right). Stu1-TOG1-TOG2 is less protease sensitive than Stu2-TOG1-TOG2, consistent with a more compact structure (less flexible linker sequence). (B) Left, SAXS scattering intensity profiles for TOG1-TOG2 fragments from Stu1 (black) and Stu2 (gray). Curves are offset for clarity. Inset shows Guinier plots of the data and associated fit (red line). Right, normalized pair-distribution distributions (P(r)) for TOG1-TOG2 fragments of Stu1 (black) and Stu2 (gray). (C) Left, SAXS scattering intensity profile for the Stu1-TOG2 fragment. Inset shows a Guinier plot of the intensity data and associated fit (red line). Right, pair-distribution distributions (P(r)) for TOG2. (D) Crystal structure of Stu1-TOG2 (cartoon) fitted into a three-dimensional (3D) volume reconstructed from the SAXS data for TOG2 (see C). Two orthogonal views of the fitted are shown. (E) Two alternative dockings of TOG2 into the 3D volume reconstructed from the SAXS data for TOG2, with models for disordered parts of the structure represented as a ribbon. Left, same docking as in D showing that in this orientation the disordered N terminus fills an empty region at the bottom of the reconstructed volume; right, alternative docking in which the TOG domain is rotated ∼180° around an axis perpendicular to the page; in this orientation the disordered N terminus fills an empty region at the top right of the reconstructed volume.

