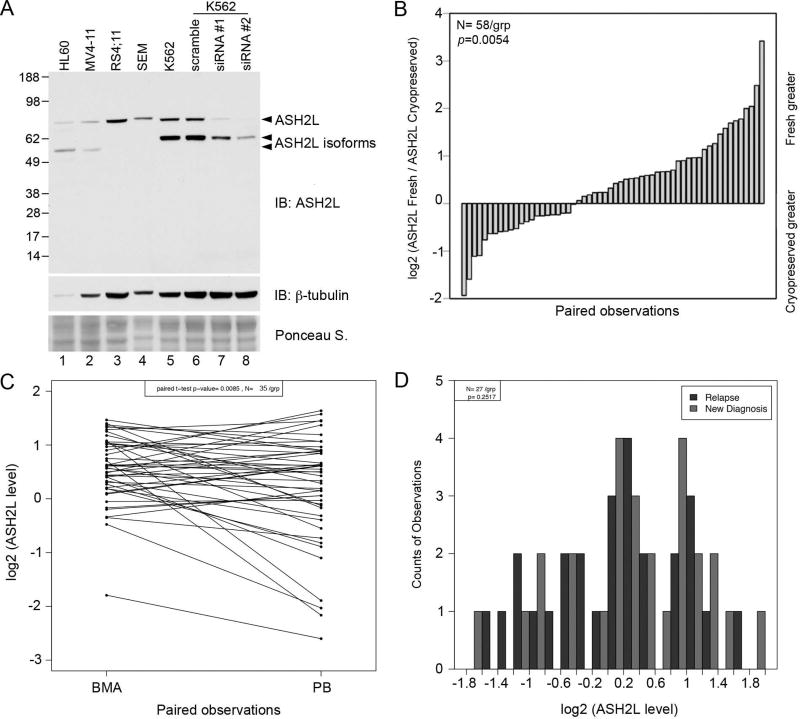
Figure 1. Analysis of ASH2L protein expression in leukemia cell lines and patient samples.
(A) Western blot analysis of ASH2L protein expression in leukemia cell lines of varying lineages. (B) RPPA was used to determine ASH2L levels in 58 paired cryopreserved and freshly prepared samples, which were compared by paired t test (P = 0.0054). (C) ASH2L levels were determined by RPPA in 35 paired peripheral blood (PB) and bone marrow (BMA) samples, and compared by paired t test (P = 0.0085). (D) ASH2L expression was measured by RPPA, and a comparison was made using 27 paired samples that were collected from patients when newly diagnosed and upon relapse (P = 0.2517).

