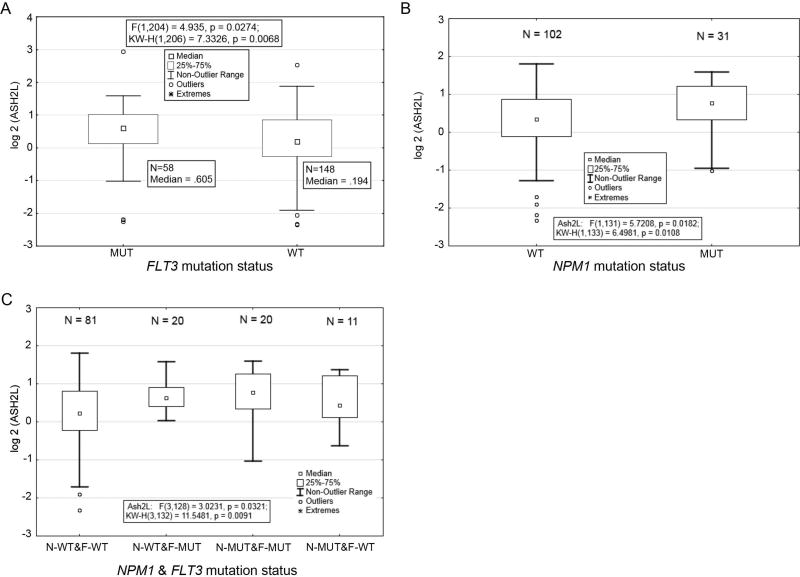
Figure 3. ASH2L protein levels in AML patients with FLT3 and NPM1 mutations.
(A) Comparison of ASH2L protein expression in AML patient samples with wild-type (WT) or mutant (MUT; ITD and D835Y) FLT3 (P = 0.0274). (B) Comparison of ASH2L protein levels in patient samples with WT or mutant (4 BP Ins) NPM1 (P = 0.0182). (C) Comparison of ASH2L protein expression in AML patient samples with combined FLT3 and NPM1 mutations (P = 0.0321).

