
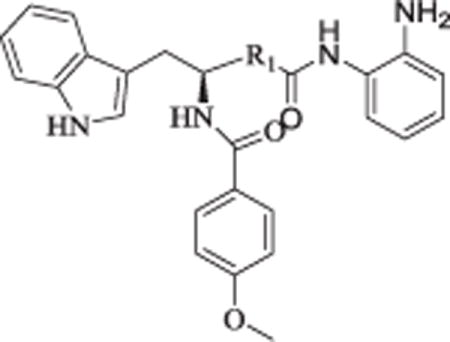
Table 3.
In Vitro inhibition of HDACs isoforms of representative Compounds.a
| ||||
|---|---|---|---|---|
|
| ||||
| Cpd No. | R1 | IC50 (nM)
|
||
| HDAC1 | HDAC2 | HDAC3 | ||
| 3 |
|
49.6 | 441 | 227 |
| 11a |
|
20.6 | 157 | 138 |
| 19 |
|
58.6 | 296 | 42.9 |
| 30a |
|
14.7 | 111 | 90.0 |
| 30b |
|
>20000 | >20000 | >20000 |
| 22 |
|
284 | 217 | 261 |
| 37 |
|
29.9 | 21.2 | 223 |
a
Assays were performed in replicate (n ≥ 2); The SD values are < 20% of the mean.