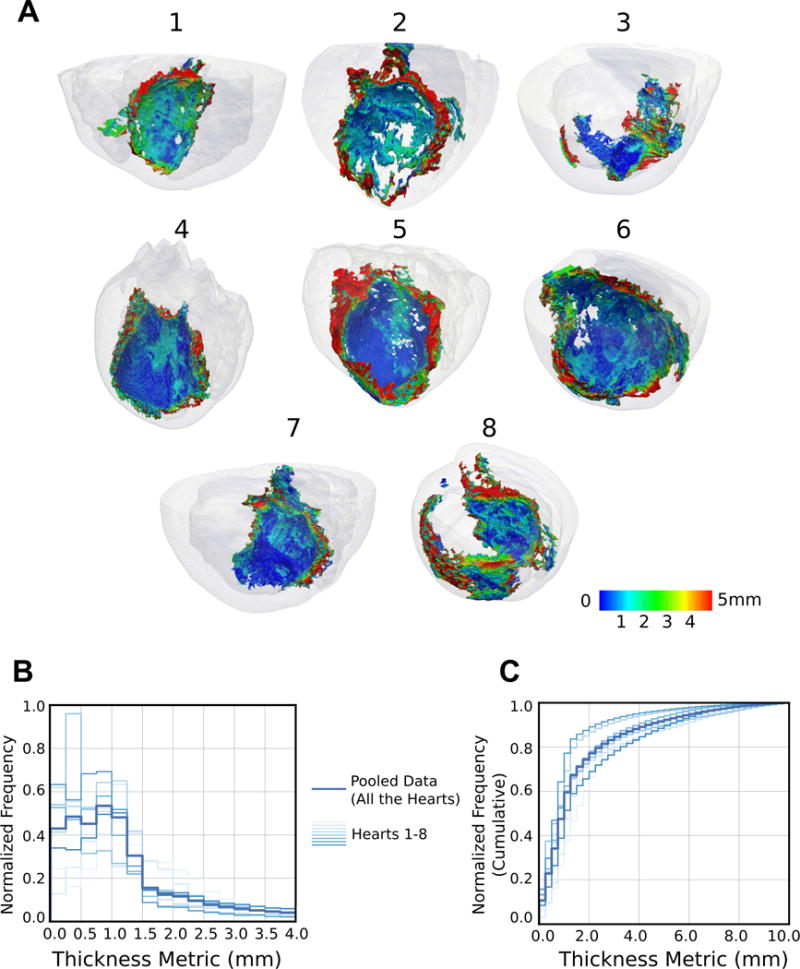
Figure 3.

Visualization and characterization of surviving tissue surrounding the scar. (A) 3D geometries of 8 infarcted hearts with the scar surface color-coded with SMLT metric. The hearts are viewed from the posterolateral side such that the endocardial aspect of the infarct is visible. (B) Histograms of the occurrence of surviving tissue at different SMLT metric values, calculated in all the 8 hearts (left: normalized, and right: cumulative histograms).
