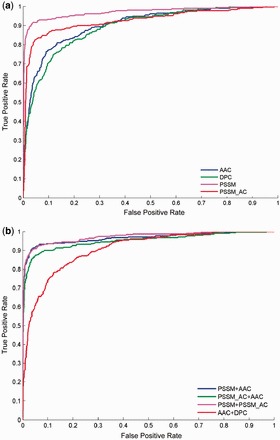
Fig. 3.

Comparison of ROC curves for IVB effector prediction using different features. The results obtained from amino acid composition (AAC), residue pair composition (DPC), PSSM composition (PSSM) and auto covariance transformation of PSSM profiles (PSSM_AC) as well as the combination of AAC and DPC (AAC+DPC), the combination of AAC and PSSM (PSSM+AAC), the combination of AAC and PSSM_AC (PSSM+ AAC) and the combination of two PSSM feature classes (PSSM+ PSSM_AC) are shown as color curves. (a) Five-fold cross-validation tests in T4_1472 using four single feature classes; (b) 5-fold cross-validation tests in T4_1472 using four combined feature classes
