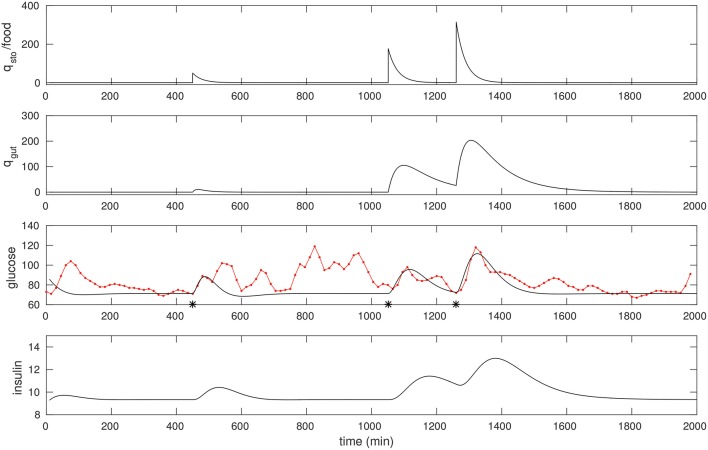
Figure 2.
The CGM of around 24 h of a non-diabetic subject, starting at midnight. The glucose data (red) is overlaid with the model simulation (black). Three foods were selected, and the times they were taken (450, 1,051, and 1,260 respectively) were recalled from the food diary; these are marked with asterisks. The first is a liquid meal at breakfast while the other two are mixed meals (the last one being dinner). These food pulses were fit; the fitted qsto amplitudes are 50, 177, and 316 respectively.

