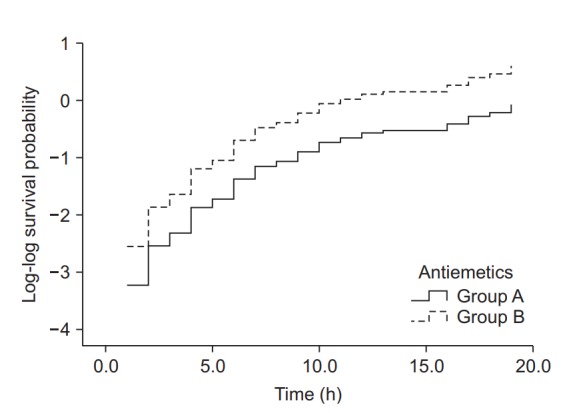
Fig. 6.

Log-log function curves for the antiemetic comparison experiment. The Y-axis represents the log-log transformed survival function estimated using the Cox proportional hazards regression model. The basic assumption of Cox proportional hazards regression modeling, a constant hazard ratio over the time (the proportional hazards assumption), can be checked using this plot for only one covariate, the antiemetic. The two curves do not cross over in the early period of observation and remain parallel after that. This plot suggests that this model does not violate the proportional hazards assumption (Created with: IBM® SPSS® Statistics ver. 23 [IBM Corp., USA]).
