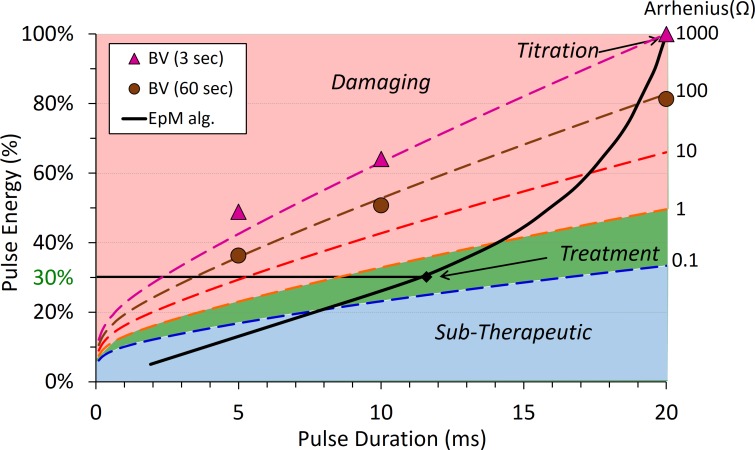
Figure 1.
Endpoint Management algorithm. Dashed lines, corresponding to different clinical grades, differ by an order of magnitude in Arrhenius integral Ω. The red area corresponds to the damaging settings and green to the nondamaging range of HSP expression; blue is below the threshold for cell response. Titration of 100% corresponds to barely visible lesion (BV) observed at 3 seconds.

