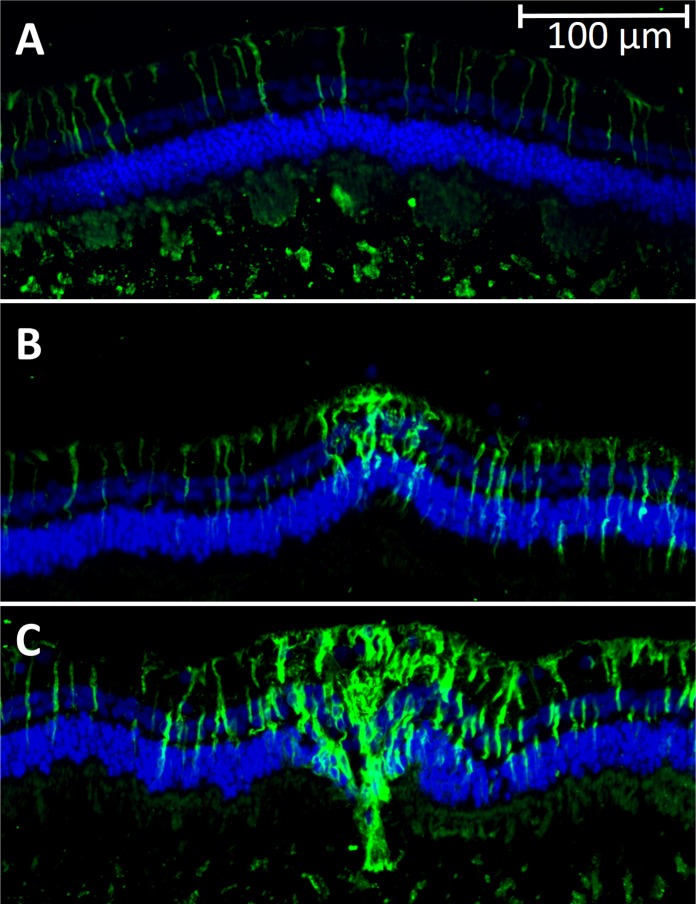
Figure 4.
GFAP expression in the retina. GFAP expression in the retina 4 weeks after laser treatment. Green fluorescent marker indicates GFAP activation, while blue is DAPI staining of the nuclei. (A) Control area shows low background level of GFAP; (B) 30% laser lesion with GFAP expression in the inner retina; (C) 100% laser lesion with wider GFAP expression throughout the retina. Expression extends to the right of the lesion due to proximity to the next spot in the pattern (not visible in this photo).

