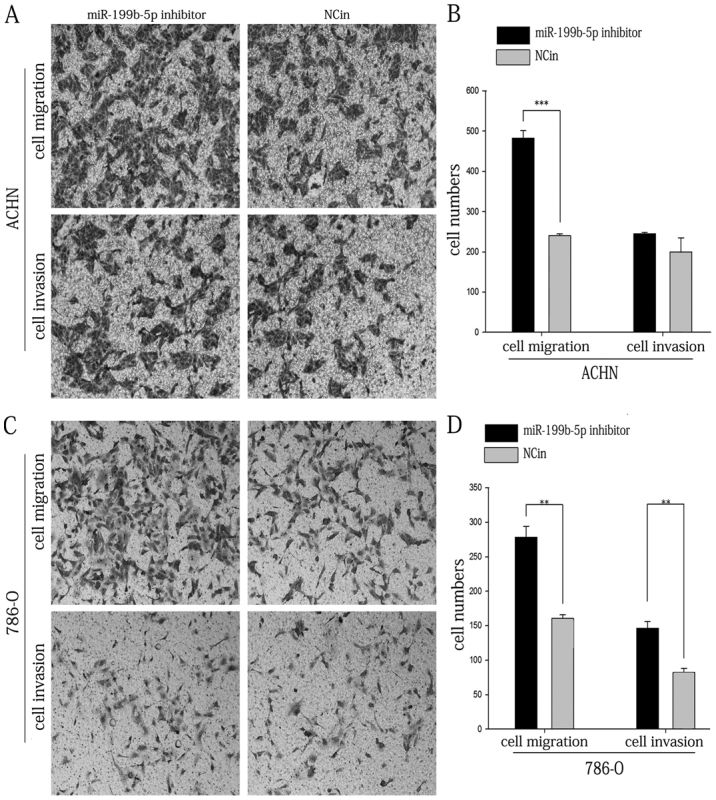
Figure 5.

Transwell assay of ACHN and 786-O cells. (A) Representative images of the lower side of the Transwell membranes with invaded and migrated ACHN cells. (B) The numbers of migratory and invasive ACHN cells were quantified. (C) Representative images of the lower side of the Transwell membranes with invaded and migrated 786-O cells (magnification, ×100). (D) The numbers of migratory and invasive 786-O cells were quantified. **P<0.01, ***P<0.001. miR, microRNA; NCin, negative control inhibitor.
