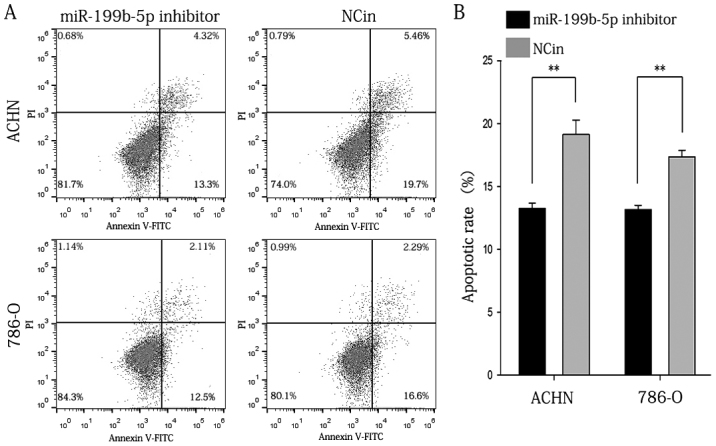
Figure 7.

Flow cytometric analysis of apoptosis. (A) Representative flow cytometry dot plots. (B) Apoptotic rate of ACHN and 786-O cells transfected with miR-199b-5p inhibitor compared with that of cells transfected with NCin. The above data were the average result of three replicates of experimental data. The graph chosen was typically represented. **P<0.01. NCin, negative control inhibitor; miR, microRNA; FITC, fluorescein isothiocyanate; PI, propidium iodide.
