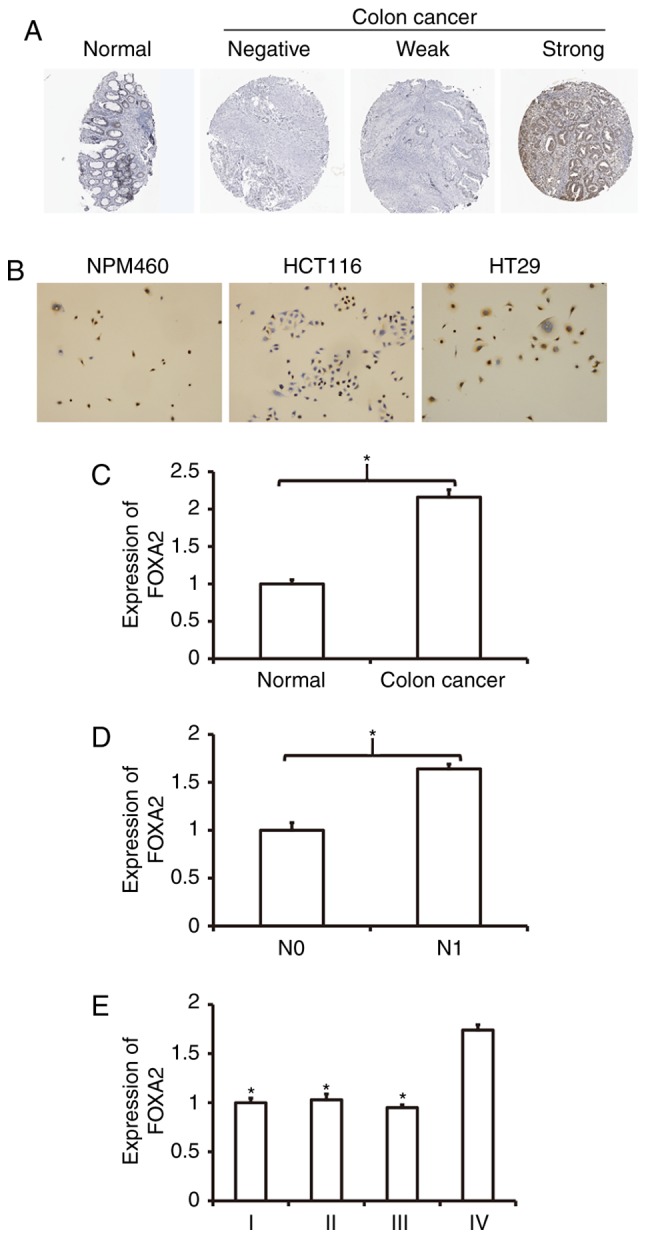
Figure 1.

Expression and distribution of FOXA2 in colon cancer. (A) Expression of FOXA2 in colon cancer tissues shown by immunohistochemistry. The figure was obtained from the Human Protein Atlas database (https://www.proteinatlas.org/ENSG00000125798-FOXA2/tissue/colon#) (38). (B) Expression and distribution of FOXA2 in colon cancer HCT116 and HT29 cells. Magnification, ×100. (C-E) Expression of FOXA2 mRNA in (C) normal and colon cancer tissues (*P<0.05 compared with normal), (D) patients without/with lymphatic metastasis (*P<0.05 compared with stage N0), or (E) patients in different clinical stages (comparison of multiple groups was performed using ANOVA followed by Tukey's/Dunnett's test; *P<0.05 compared with IV).
