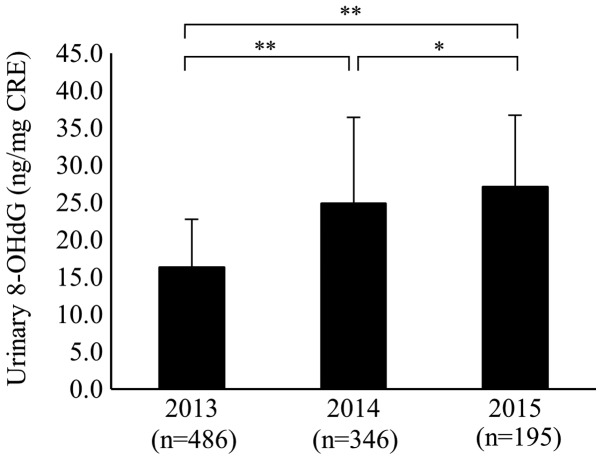
Figure 1.
Serial changes in the level of urinary 8-OHdG for all subjects. Error bars indicate standard deviation. The mean values of urinary 8-OHdG in 2014 and 2015 were significantly higher than in 2013. The urinary 8-OHdG in 2015 was significantly higher than that in 2014. (Coefficient of variance for measuring instrument: 9.3–19.7%). *P<0.05 and **P<0.01. 8-OHdG, 8-hydroxy-2′-deoxyguanosine.

