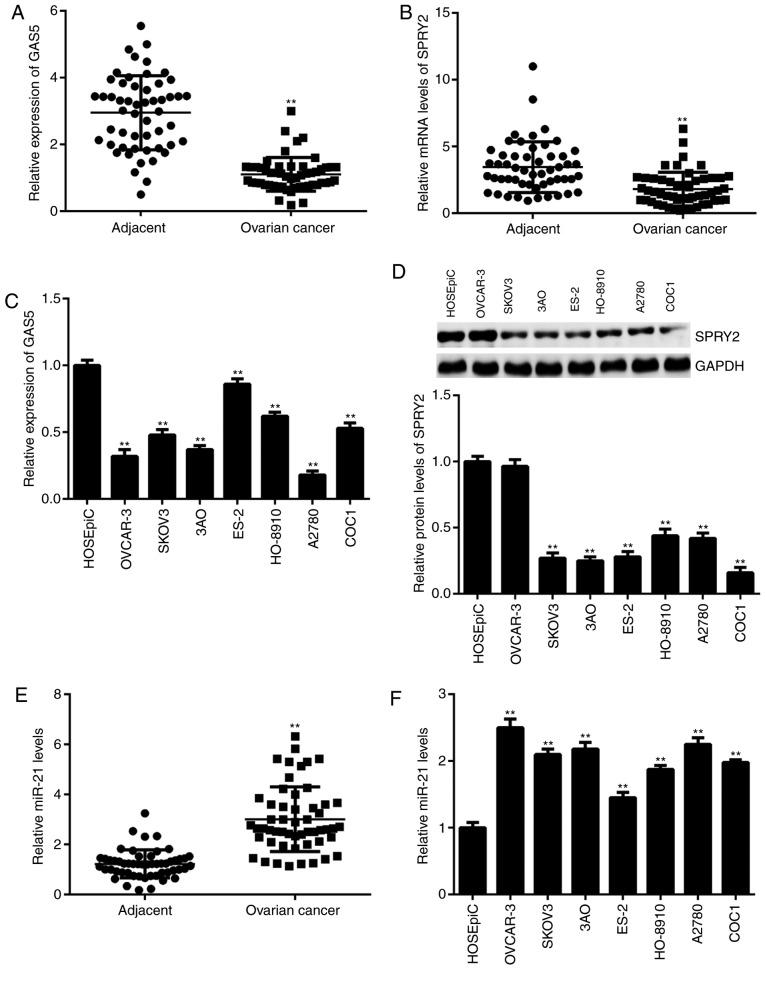
Figure 1.
Expression of GAS5, SPRY2 and miR-21 in ovarian cancer tissues and cell lines. (A and B) qPCR was used to examine the expression levels of GAS5 and SPRY2 in ovarian cancer tissues compared with adjacent non-tumor tissues. **P<0.01 vs. Adjacent. (C) qPCR and (D) western blot analysis were used to examine the expression levels of GAS5 and SPRY2 in ovarian cancer cell lines compared with normal ovarian epithelial cells. **P<0.01 vs. HOSEpiC. (E) qPCR was used to examine the miR-21 levels in ovarian cancer tissues compared with adjacent non-tumor tissues. **P<0.01 vs. Adjacent. (F) qPCR was used to examine the miR-21 levels in ovarian cancer cell lines compared with normal ovarian epithelial cells. **P<0.01 vs. HOSEpiC. GAS5, growth arrest-specific transcript 5; SPRY2, Sprouty homolog 2; qPCR, quantitative polymerase chain reaction; miR, microRNA.

