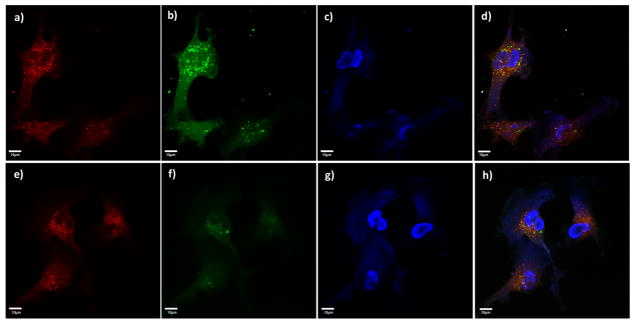
Figure 2.
Confocal microscopy showed stronger interaction for HA-NWs (a–d) than the corresponding HA-SPIONs (e–h) with CD44-expressing cells such as vascular endothelial cells EA.hy926: (a, e) red lysotracker channel showing locations of the lysosomes; (b, f) FITC channels showing locations of the nanoprobes; (c, g) DAPI channels showing location of nuclei; (d, h) overlays of red lysotracker and green FITC and DAPI channels. Scale bars are 10 μm.

