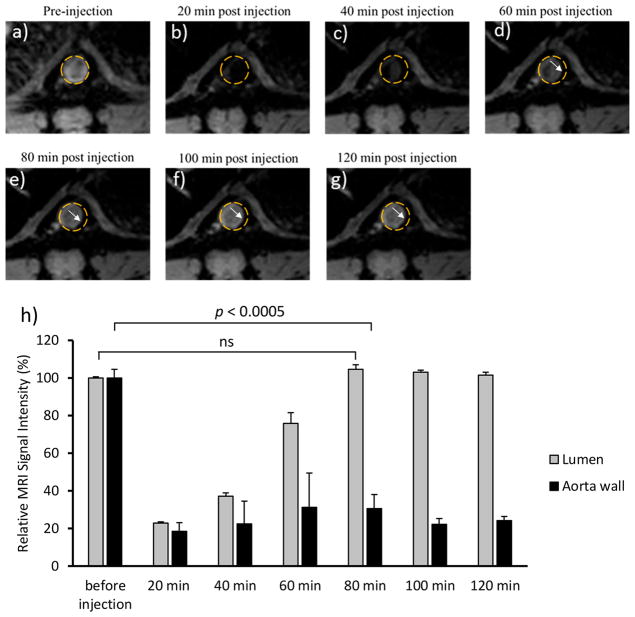
Figure 8.
T2*-weighted MR images of ApoE knockout mice aorta (a) before injection of HA-NWs (8 mg Fe/kg body weight) and different time intervals after injection of HA-NWs (b–g). Areas of the aorta walls that have undergone contrast changes are highlighted by white arrows. (h) Quantification of signal intensity changes for lumen and aorta wall before injection and at different time intervals after injection of HA-NWs. The p-value was obtained from student’s t test.

