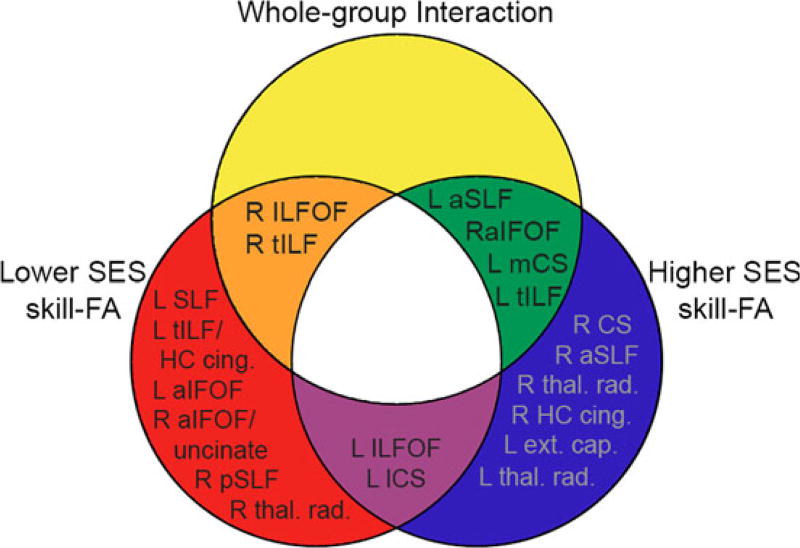
Figure 2.
Relationships between clusters significant for whole-group interaction, lower SES skill–FA correlation, and higher SES skill–FA correlation. There were overlapping and unique regions between the whole-group interaction and within-subgroup skill–FA analyses. Clusters significant in the interaction and lower SES subgroup listed in orange section (right ILFOF, right temporal ILF); clusters significant in the interaction and higher SES subgroup listed in green section (left anterior SLF, left medial corticospinal tract (mCS), left temporal ILF, right anterior IFOF). Clusters significant in only the lower SES subgroup listed in red section (left SLF, left temporal ILF/hippocampal cingulum, left anterior IFOF, right anterior IFOF/uncinate fasciculus, right parietal SLF, right thalamic radiation); clusters significant in only higher SES subgroup listed in blue section (right corticospinal tract (CS), right anterior SLF, right thalamic radiation, right hippocampal cingulum, left external capsule, left thalamic radiation); clusters significant in both SES subgroup analyses but not in whole-group interaction listed in purple section (left ILFOF, left lateral corticospinal (lCS) tract).

