
Figure 7. Introduction of Gal4 transcriptional logic sequences with ssODNs.
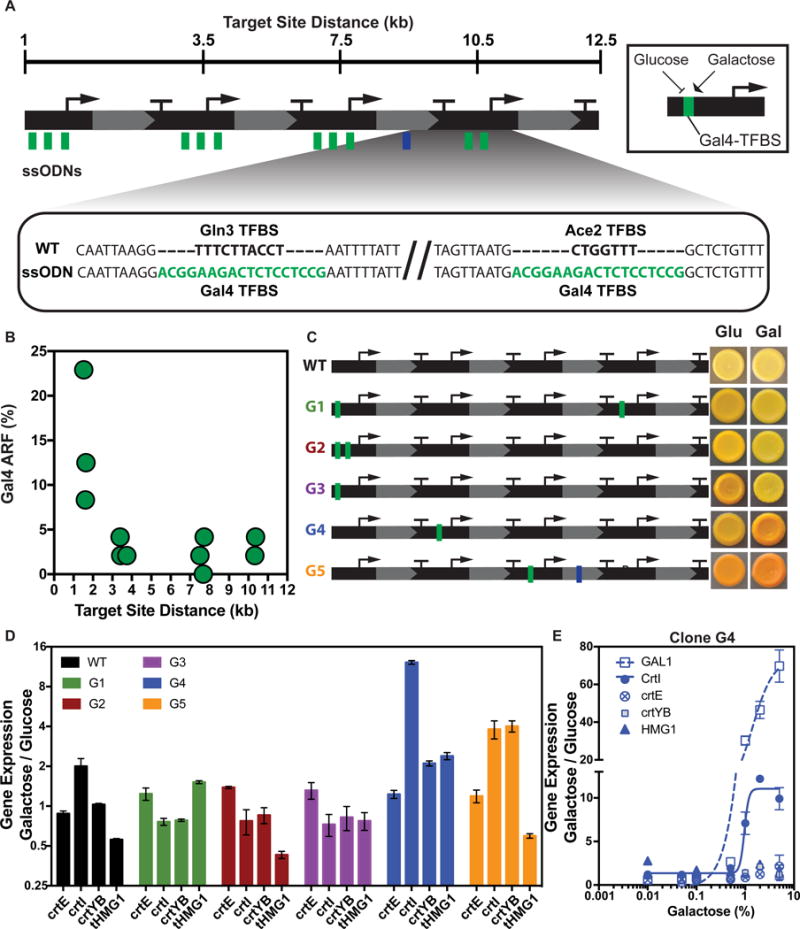
(A) ssODNs containing the 18-nt Gal4 (green) binding site targeted to replace native TFBS (bold) in promoters and a ssODN containing crtYB-D52G mutation (blue) at distances between 1 and 11kb across the pathway. (B) Plot shows observed ARF for each Gal4 ssODN at the indicated distance. n=48 sequenced clones. (C) Mutant pathways containing Gal4 TFBS inserted in promoters and clonal spots show phenotypes of the clones on glucose (Glu) and galactose (Gal). (D) Fold-change in gene expression in galactose vs. glucose. (E) Fold-change in gene expression of clone G4 across a range of galactose at the native GAL1 gene, and the engineered pathway. Non-linear curve fit for GAL1 and crtI. R2 = .97(GAL1) and .96(crtI). Values in D,E represent mean +/− SD for three replicates. See also Table S7.