
Figure 2.
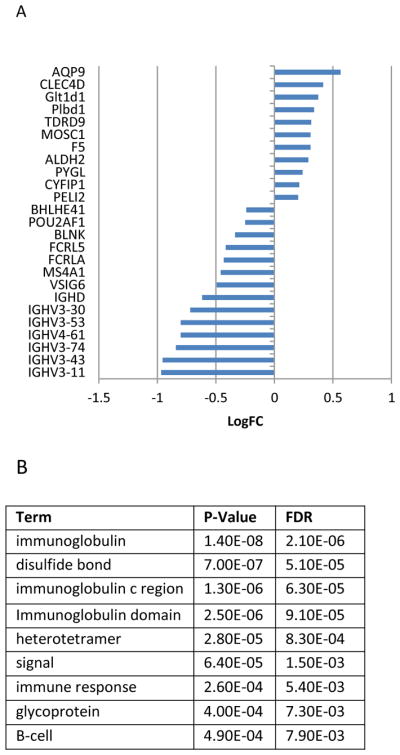
Differentially expressed peripheral blood mononuclear cell (PBMC) genes and Protein information resource (PIR) enrichment after adalimumab treatment identified by expression microarray. A) Log 2 fold change of top 25 differentially expressed genes in PBMCs is listed. B) PIR terms, p-values and false discovery rate (FDR) identified by DAVID enrichment analysis based on gene list.