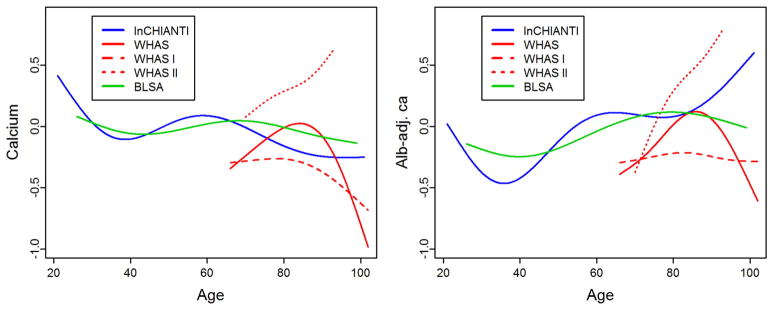
Fig. 1.
Calcium trajectory with age. Changes with age are shown for unadjusted calcium (left panel) and albumin-adj ca (right panel) variables. Trajectories were estimated using Bayesian mixed models with age as a cubic spline (with 5 knots for InCHIANTI and BLSA, and 4 knots for WHAS, see Appendix for details) for three longitudinal cohorts, as indicated with different colors. Analyses for WHAS were performed either combining WHAS I and WHAS II (solid lines), or with either one (dashed lines for WHAS I and dotted lines for WHAS II). Age started at 66 for WHAS, while InCHIANTI and BLSA had a small fraction of younger subjects.

