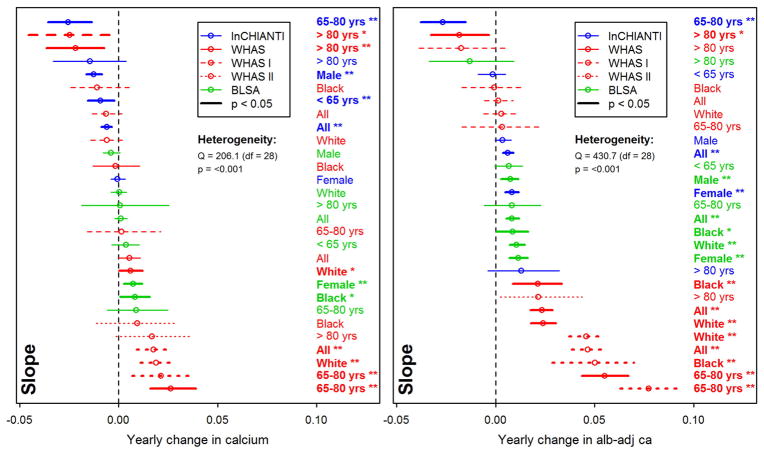
Fig. 2.
Yearly changes in calcium with age. Trajectories for unadjusted calcium (left panel) and albumin-adj ca (right panel) variables were estimated using Bayesian linear mixed models (see Appendix for details). Each line represents a single analysis in a single subpopulation, as indicated by the colors, lines, and labels at right; the relative positions of the lines thus permits us to assess the heterogeneity of relationship between calcium levels and age. Note that the x-axes are for change in the variables after a standard normal transformation, such that a change of 1 represents a change of 1 standard deviation from the population mean of 0. Slopes greater than zero thus indicate that calcium is increasing with age, and slopes smaller than zero that it is declining with age. Slopes (points) obtained are plotted with their 95% confidence intervals (CIs; segments). Analyses for WHAS were performed either combining WHAS I and WHAS II (solid lines), or with either one (dashed lines for WHAS I and dotted lines for WHAS II). Results for heterogeneity tests are also indicated. Significant results are plotted in bold (and CIs do not overlap the vertical line), with asterisks indicating the significance level (***, p < 0.001; **, p < 0.01; *, p < 0.05).

