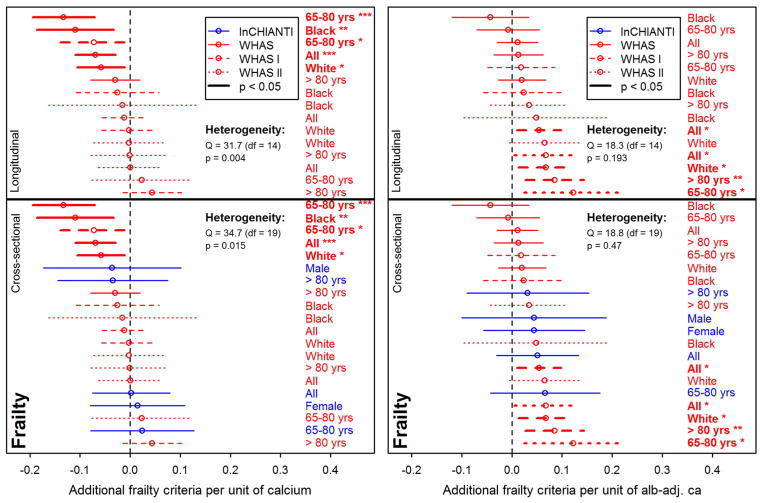
Fig. 4.
Relationships between calcium and frailty. Each line represents a single analysis in a single subpopulation, as indicated by the colors, lines, and labels at right; the relative positions of the lines thus permits us to assess the heterogeneity of relationship between calcium levels and frailty. Poisson regression models were performed on the number of Fried's frailty criteria (Fried et al., 2001) for unadjusted calcium (left panel) and albumin-adj ca (right panel) variables, adjusting for age with a cubic spline. Estimations (points) together with 95% confidence intervals (CIs; segments) are plotted. Longitudinal analyses are shown on the top panels (for WHAS only) and cross-sectional analyses (using the number of frailty criteria at first visit only) are presented on the lower panels. See Fig. 2 for further explanations.

