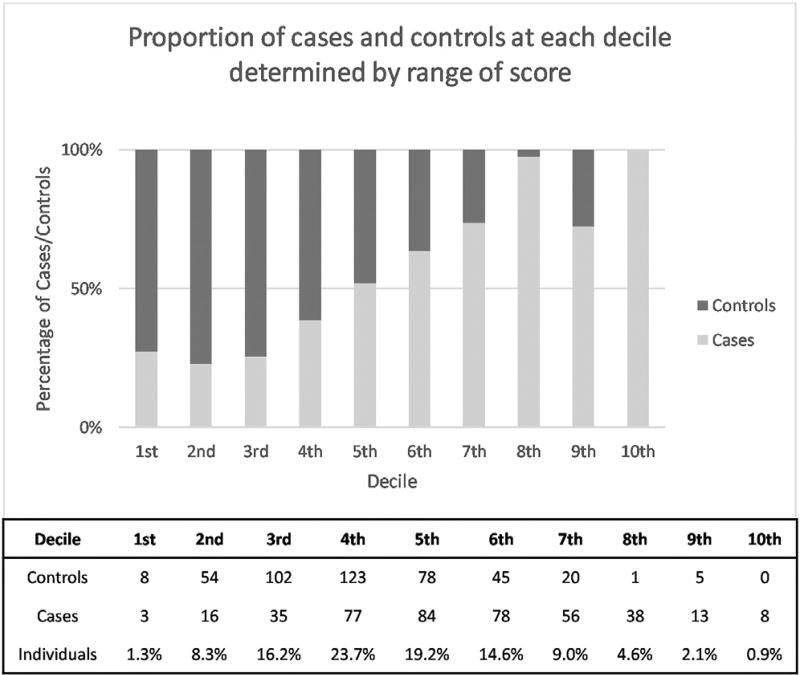
Fig. 1.
Proportion of diagnosed sEOAD cases and controls at each decile determined by a range of score. The figure breaks down the range of PRS into deciles. The range of scores which make up each decile are depicted, as well as the number of cases and controls, and the percentage of individuals which fall into each decile. Controls are right skewed, whereas cases demonstrate left skewness. These figures were produced from PRS of 408 sEOAD cases and 436 controls. The embedded table lists the decile ranges with the number of cases and controls in each decile along with the proportion of the cohort which make up each decile. Abbreviations: PRS, polygenic risk score; sEOAD, sporadic early-onset Alzheimer’s disease.

