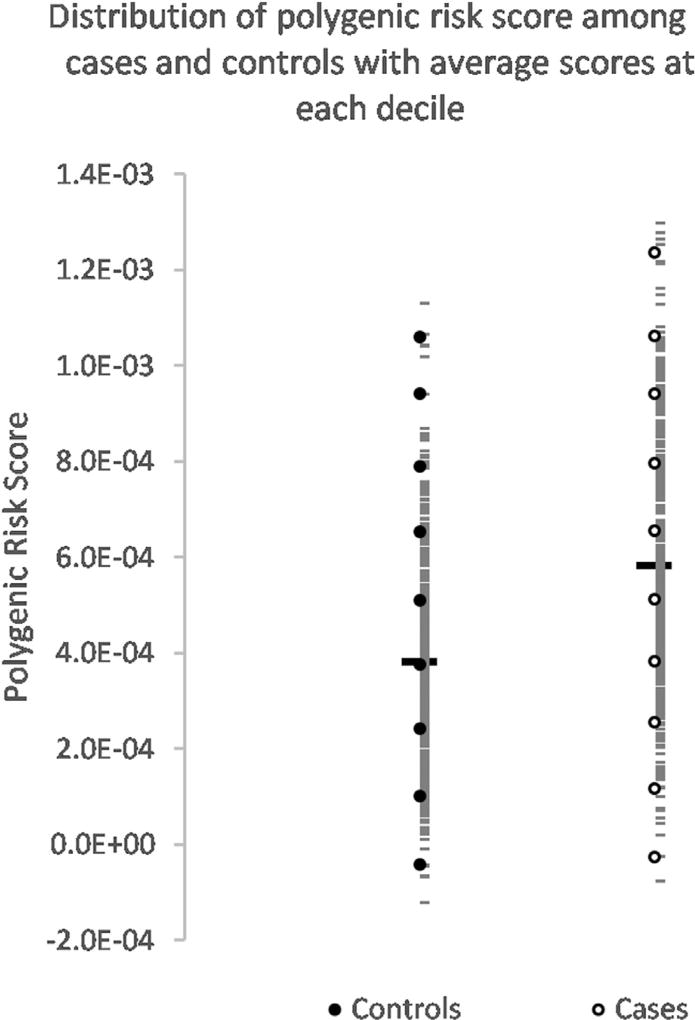
Fig. 2.
Distribution of polygenic risk score among sEOAD cases and controls with average scores at each decile. The range of PRS obtained for cases and controls is distributed into deciles. The range of coverage of each decile is shown in the bar plot together with the proportion of cases and controls which make up each decile. The average scores for all cases and controls are indicated by the thick bar, while the short horizontal bars show PRS for each individual. Average scores at each decile are indicated as hollow circles for cases and filled circles for controls. Abbreviations: PRS, polygenic risk score; sEOAD, sporadic early-onset Alzheimer’s disease.

