
Figure 2. Age-adjusted death rates for cerebrovascular disease by race, by year—United States, 1999–2010.
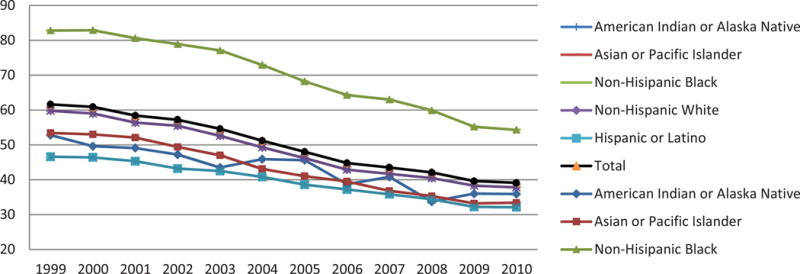
Rates per 100,000 population, standardized to the U.S. 2000 standard population
Official websites use .gov
A
.gov website belongs to an official
government organization in the United States.
Secure .gov websites use HTTPS
A lock (
) or https:// means you've safely
connected to the .gov website. Share sensitive
information only on official, secure websites.
Rates per 100,000 population, standardized to the U.S. 2000 standard population