Fig. 1.

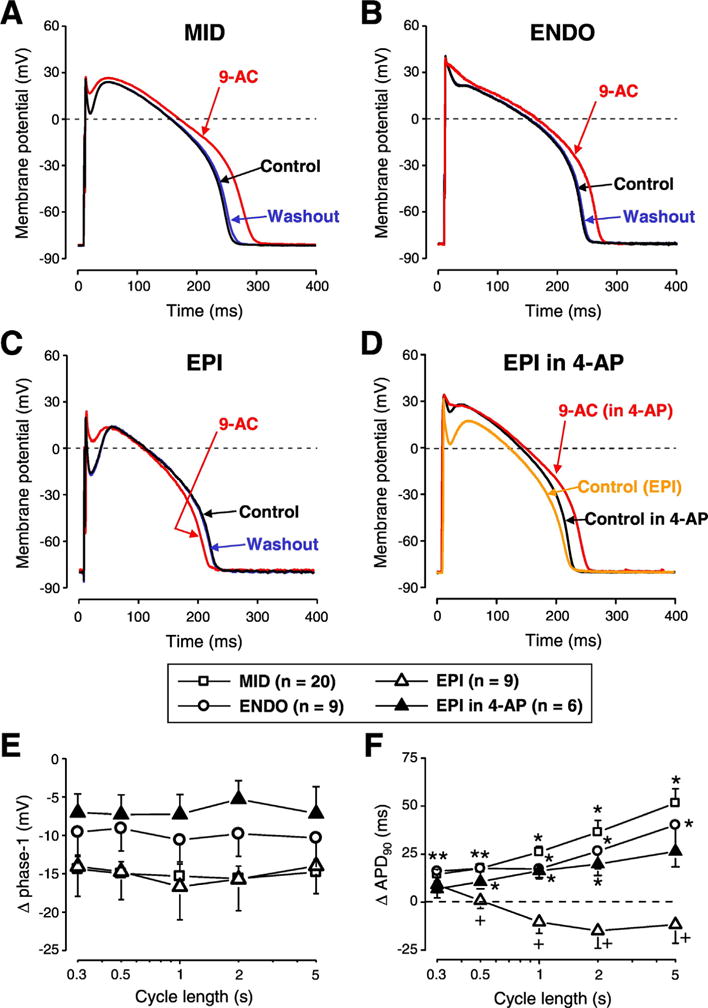
The contribution of ICl(Ca) to the AP contour differs in various transmural layers of canine left ventricular myocardium. Representative APs recorded in control conditions (black), in the presence of 0.5 mmol/L 9-anthracene carboxylic acid (9-AC) (red) and after washout (blue) in cells obtained from midmyocardium (A, MID), subendocardium (B, ENDO) and subepicardium (C, EPI). Panel D shows a representative experiment where 9-AC was used in the presence of 1 mmol/L 4-aminopyridine (4-AP) in an EPI cell. 9-AC-induced changes in phase-1 (E) and APD90 (F) are shown in various cell types and conditions as indicated by the symbols. Symbols and bars represent mean ± SEM values, n shows the number of experiments. On panel E every 9-AC induced change in phase-1 was statistically significant. On panels F asterisks denote 9-AC-induced significant changes while + signs indicate significant difference between EPI and EPI in the presence of 4-AP. (For interpretation of the references to colour in this figure legend, the reader is referred to the web version of this article.)
