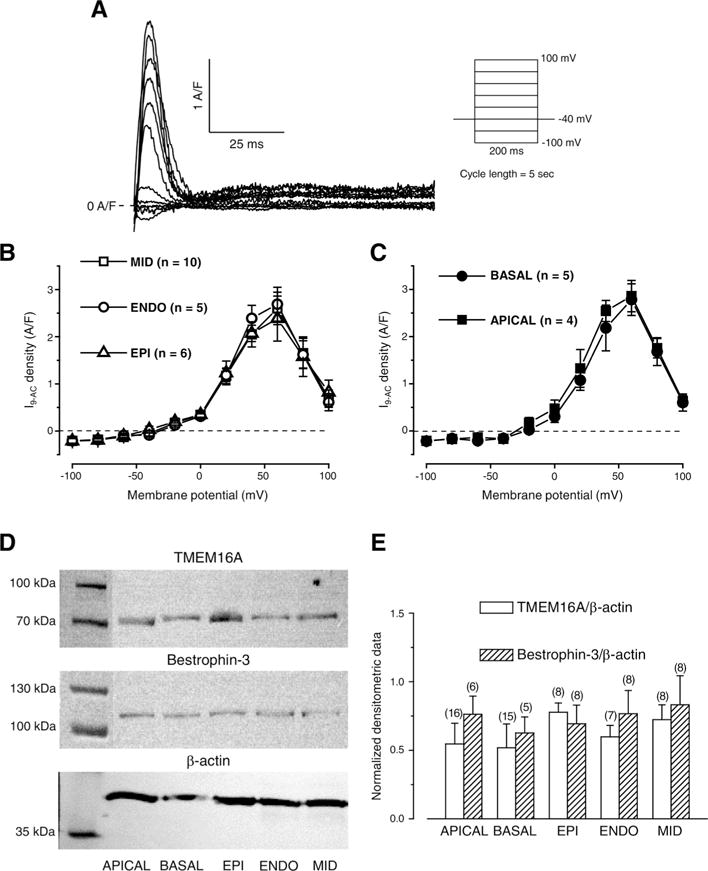
Fig. 3.

Regional ICl(Ca) densities and normalized expression levels of TMEM16A and Bestrophin-3. Representative 0.5 mmol/L 9-AC-sensitive currents (I9-AC) evoked with the stimulation protocol shown on the right side (A). Voltage dependence of I9-AC measured in cells obtained from various left ventricular layers (B) and from apical and basal regions of the left ventricular midmyocardium (C) using conventional square pulses. Representative Western blot images (D) showing expression of TMEM16A, Bestrophin-3, and β-actin (from top to bottom). Densitometrical values of TMEM16A (empty columns) and Bestrophin-3 (striped columns) both normalized to β-actin (E). Columns and bars indicate mean ± SEM values, n shows the number of experiments.
