
Fig. 4.
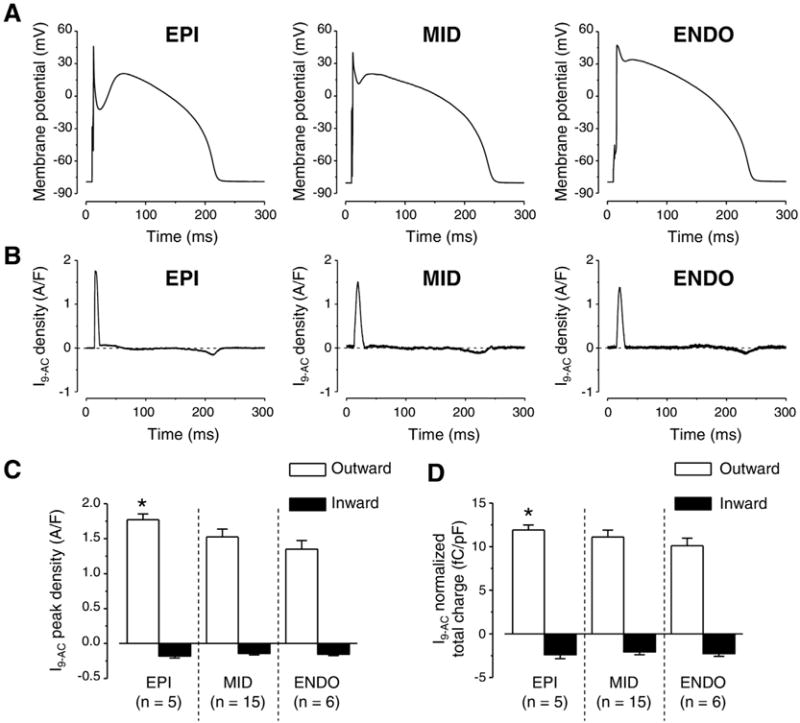
Transmural variation of ICl(Ca) profiles obtained with AP voltage-clamp recordings. Representative APs obtained in EPI, MID, and ENDO cells from left to right (A) and the corresponding ICl(Ca) profiles (B) recorded as 0.5 mmol/L 9-AC-sensitive currents (I9-AC) are illustrated. I9-AC peak densities (C) and total charges (D) measured during outward (white columns) and inward currents (black columns). Columns and bars indicate mean ± SEM values, asterisks denote significant differences between EPI and ENDO, n shows the number of experiments.