
Fig. 5.
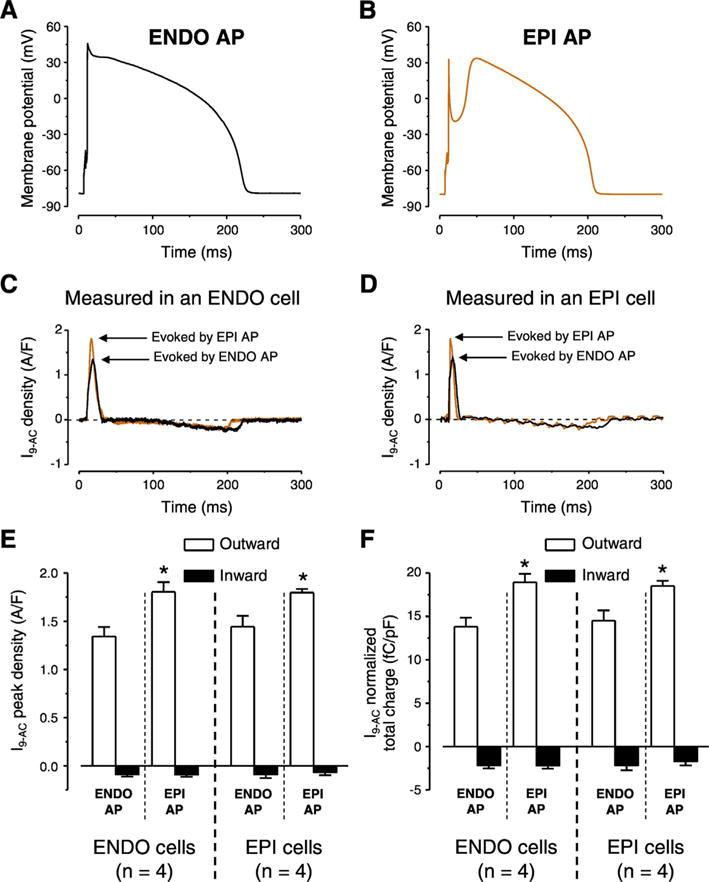
AP configuration dependent ICl(Ca) profiles measured with APVC conditions. Typical ENDO (A) and EPI (B) APs used as voltage commands in cells obtained from both ENDO and EPI layers. ICl(Ca) profiles recorded as 0.5 mmol/L 9-AC-sensitive currents (I9-AC) in ENDO (C) and EPI cell (D) using the two typical AP waveforms. I9-AC peak densities (E) and normalized total charges (F) measured during outward (white columns) and inward currents (black columns) by the indicated waveforms on given cell types. Columns and bars show mean ± SEM values. Asterisks denote significant differences between EPI and ENDO AP evoked I9-AC parameters, n shows the number of experiments.