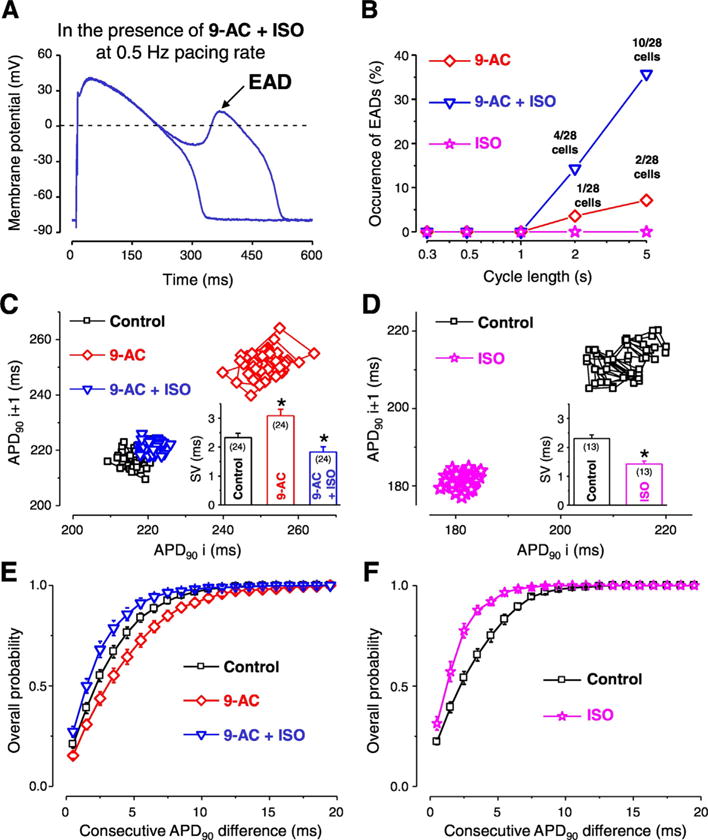
Fig. 6.

Contribution of ICl(Ca) to the short-term variability of repolarization (SV) and formation of early afterdepolarization (EAD). Representative APs recorded at 0.5 Hz pacing rate in the simultaneous presence of 0.5 mmol/L 9-AC and 10 nmol/L isoproterenol (ISO) (A). Occurrence of EAD in the presence of 9-AC alone (red diamonds), ISO alone (pink stars) and in the simultaneous presence of 9-AC and ISO (blue triangles) as a function of steady-state CL (B). Representative Poincaré plots generated from 50 consecutive APs recorded in control (black squares), 9-AC (red diamonds) and in 9-AC + ISO (blue triangles) (C). On the inset of panel C the average SV values are shown. Representative Poincaré plots generated from 50 consecutive APs recorded from another cell in control (black squares) and in the presence of ISO (pink stars) and average SV values in the inset (D). Overall probability of consecutive APD90 differences generated from 24 measurements in control (black squares), 9-AC (red diamonds), and in 9-AC + ISO (blue triangles) conditions (E). Overall probability of consecutive APD90 differences generated from 13 measurements in control (black squares) and ISO (pink stars) (F). Columns, symbols and bars indicate mean ± SEM values. Asterisks denote significant difference from control, n shows the number of experiments. (For interpretation of the references to colour in this figure legend, the reader is referred to the web version of this article.)
