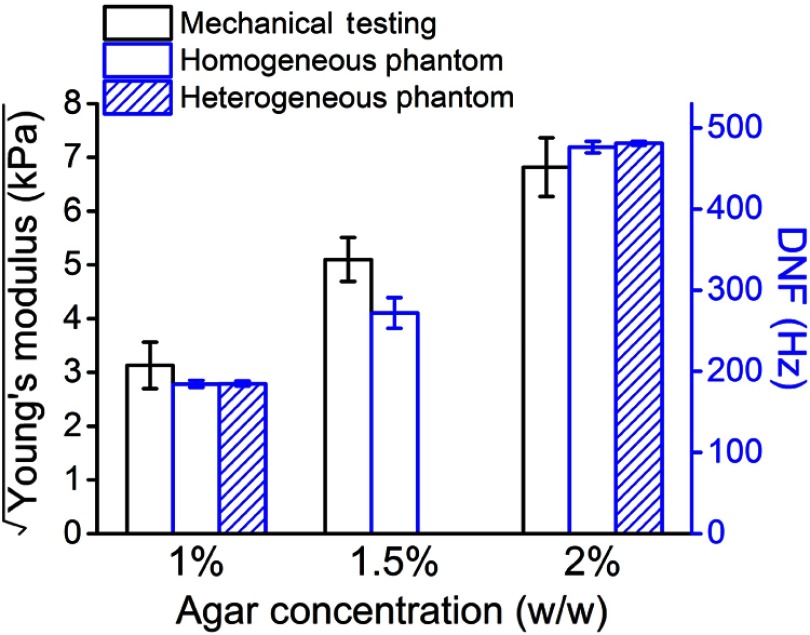
Fig. 4.
Comparison of the square root of Young’s modulus as measured by uniaxial mechanical testing ( samples for each concentration) to the DNF of the same homogeneous phantoms ( OCE measurement positions for each concentration) and the corresponding heterogeneous phantom components ( and 57 for 1% and 2% components, respectively). Error bars are the 95% confidence intervals of the means.

