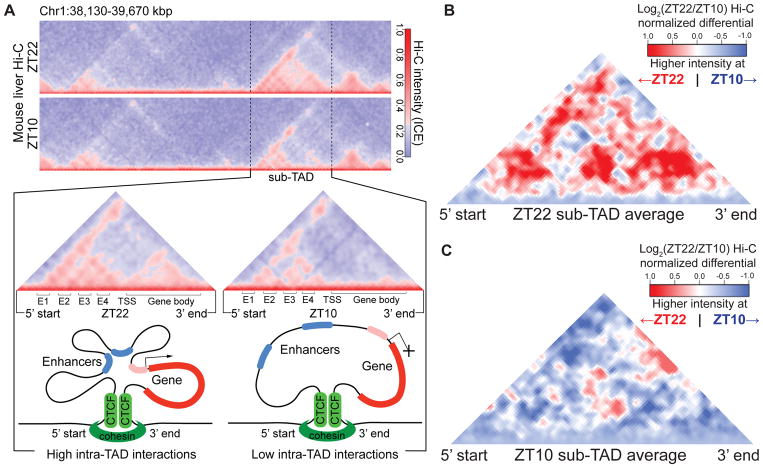
Figure 1. Circadian sub-TADs undergo rhythmic intra-TAD compaction within stable boundaries.
(A) Heat maps of ZT22 and ZT10 Hi-C demonstrating circadian intra-TAD interactions within sub-TAD boundaries (dotted lines), as represented by Hi-C intensity normalized by Iterative Correction and Eigenvector decomposition (ICE). Transcriptional start site of the Npas2 gene (TSS) forms rhythmic intra-TAD loops with upstream enhancers (E1-4) as well as with the gene body, as illustrated by schematics below. (B) ZT22 sub-TAD and (C) ZT10 sub-TAD averaged differential changes in intra-TAD interactions visualized as log2 ratio within size-normalized sub-TAD 5’ and 3’ boundaries (red= higher interaction ratio at ZT22, blue=higher interaction ratio at ZT10).

