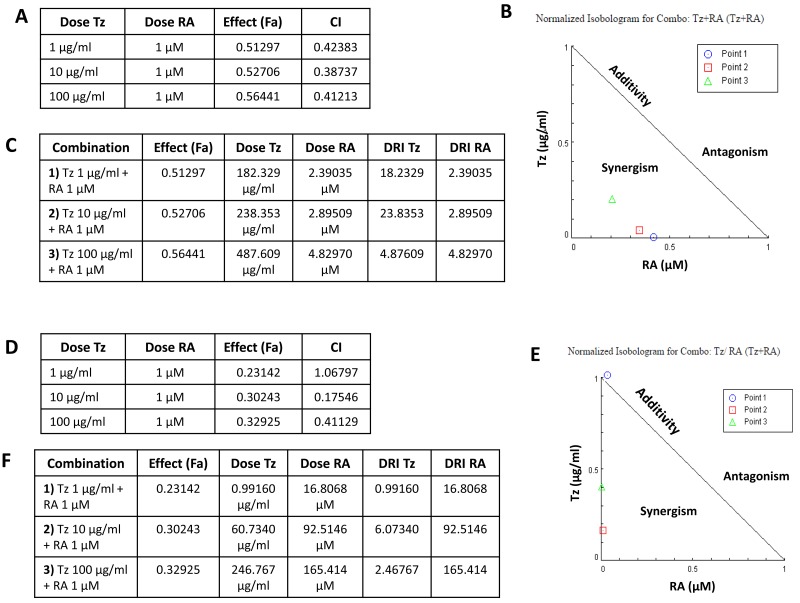
Figure 3. Tz and RA exert a synergistic inhibition of cell viability.
Analysis of the pharmacological interaction between Tz and RA. The combination index (CI) was calculated with the CompuSyn program using the 72 h-treatments of the MTT assay. When two drugs are simultaneously delivered, CI>1 indicates antagonism in the combination; CI = 0.9-1.1 additivity; and CI<1 synergism. (A-C) SKBR3 cells, (D-F) BT474 cells. (A, D) The tables show the combinations of doses tested, the effect produced by each combination, affected fraction (Fa), and the corresponding CI. (B, E) Isobolograms for the Tz and RA combination. Point 1: 1 μg/ml Tz + 10-6M RA; point 2: 10 μg/ml Tz + 10-6M RA; point 3: 100 μg/ml Tz + 10-6M RA. (C, F) Tables with the dose reduction index (DRI) for each combination.

