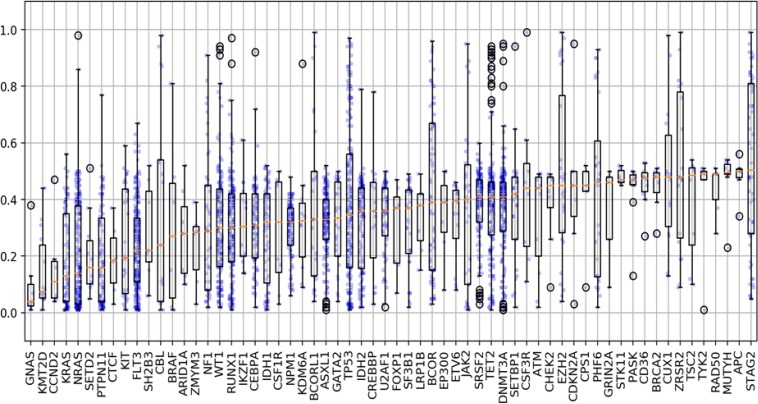
Figure 5. Variant allele frequencies for associated selected genomic alterations.
Evaluation of the differences in variant allele frequency (VAF) that occurred among short variants (SNVs, indels) and found a broad range of VAFs among all mutations tested (range 1–100%). Several mutations demonstrated VAFs well below the median (ex: NRAS/KRAS) suggesting these mutations are likely subclonal. In contrast, among several genes the VAFs were noted to be well above the median (ex: TP53, BCOR, STAG2), demonstrating that in certain patients these mutations could be clonal or represent other genomic changes. Blue dots represent AF for each mutation with outliers predicted by computational modeling highlighted in black circles.

