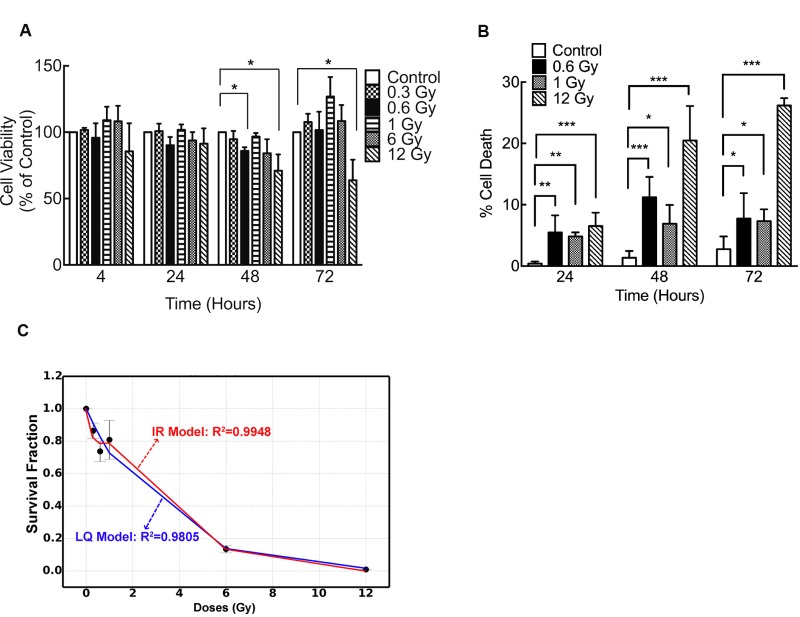
Figure 1. Low doses of IR reduce viability of DLD-1 cells.
(A) Viability of DLD-1 cells determined by MTS assay at different times and different doses of irradiation. Results are expressed as a percentage of control at each time point. (B) Cell death was evaluated with trypan blue dye exclusion assay. Data from clonogenic assay was modeled using (C) lineal-quadratic (LQ) model and induced-repair (IR) model. In A and B, results are expressed relative to control. Means ± S.D. of at least 3 independent experiments are shown. *P < 0.05; **P < 0.01; ***P < 0.001, two-way ANOVA.

