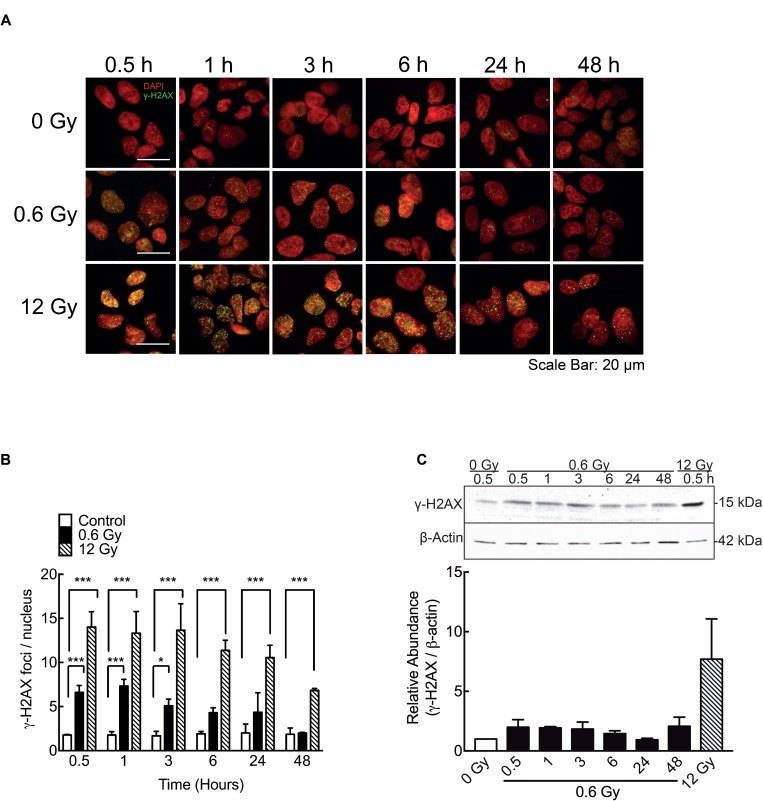
Figure 3. IR-induced DSB in DLD-1 cells.
(A) Evaluation of double strand break (DSBs) by immunofluorescence staining for γ-H2AX 48 h after irradiation. Nuclei were stained with DAPI. (B) γ-H2AX foci (Green) were quantified and normalized to the number of nuclei (Red). Cells were counted in 5 different fields and at least 100 cells were evaluated per sample. (C) A representative blot of γ-H2AX expression is shown along with a graph of the densitometry assay of the signal. The γ-H2AX signal was normalized to β-actin (loading control). Data represent the means ± S.D. of at least 3 independent experiments. *P < 0.05, ***P < 0.001, Two-way ANOVA.

