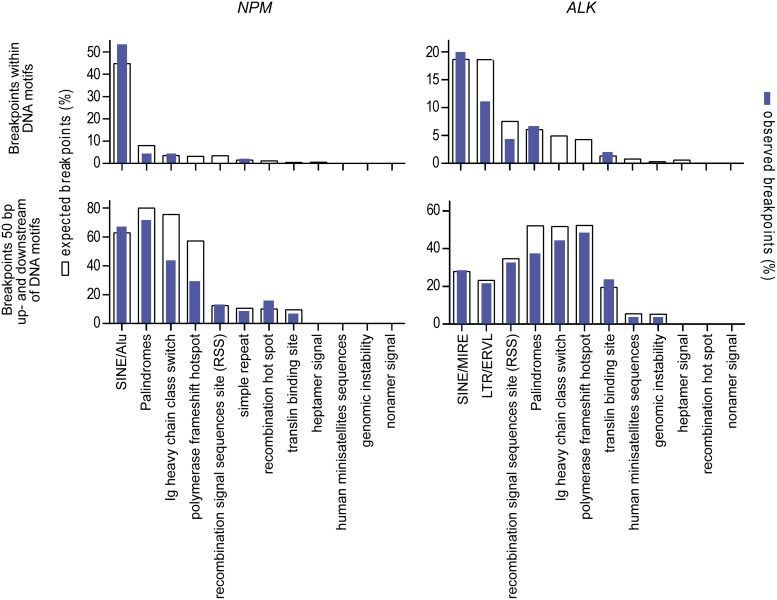
Figure 2. Localization of genomic breakpoints.
Co-localization of genomic breakpoints to repeat regions and DNA sequence motifs that could support the initiation of ALCL chromosomal translocation. White columns represent the numbers of expected breakpoints; blue columns represent the numbers of observed breakpoints within the corresponding DNA motif.

