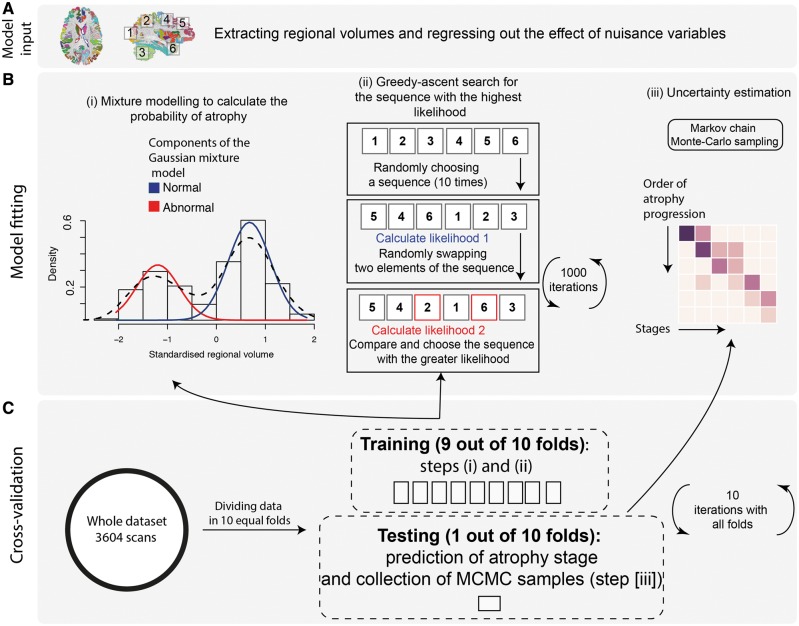
Figure 1.
The event-based model steps to estimate the most likely sequence of atrophy progression. The three steps are: (A) adjusting for nuisance variables, and region selection; (B) calculating the best-fit probability distributions for normal and atrophic brain regions; searching for the most likely sequence; and (C) quantifying the uncertainty with cross-validation. [B(i)] The distribution of the volume in an example region in healthy controls and patients and the corresponding mixture model. (ii) The steps for greedy ascent search. (iii) A matrix showing a sequence of atrophy progression on the y-axis, and the position in the sequence of each region ranging from 1 to the total number of regions on the x-axis. The intensity of each matrix entry corresponds to the proportion of Markov Chain Monte Carlo samples of the posterior distribution where a certain region of y-axis appears at the respective stage of x-axis.

