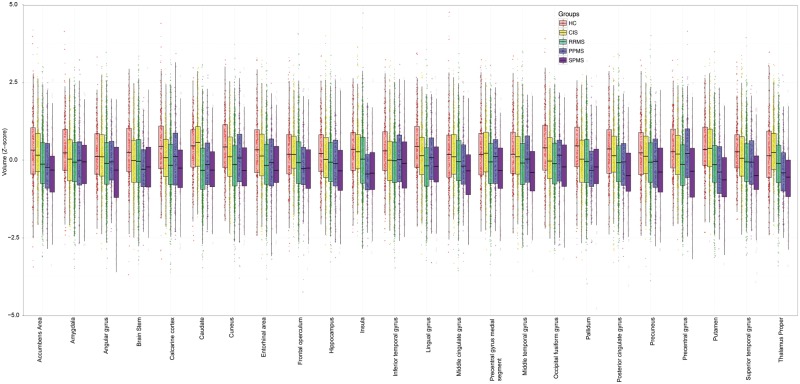
Figure 2.
Comparisons of regional volumes between groups. Box plots at y-axis show z-scores of the corresponding region shown at x-axis. Lower and upper hinges of each boxplot correspond to 25th and 75th percentiles of data. We selected 24 regions that showed significant difference (P < 0.01 corrected) between all patients with multiple sclerosis and healthy controls at baseline visit. CIS = clinically isolated syndrome; HC = healthy control; PPMS = primary progressive multiple sclerosis; RRMS = relapsing-remitting multiple sclerosis; SPMS = secondary progressive multiple sclerosis.

