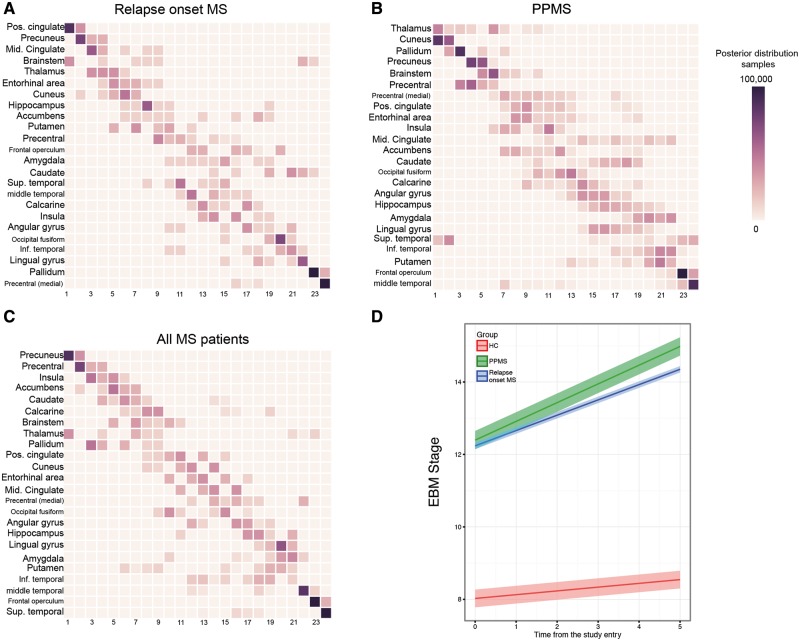
Figure 3.
Sequences of atrophy progression and patient staging. The positional variance diagrams for (A) relapse-onset multiple sclerosis, (B) primary-progressive multiple sclerosis (PPMS) and (C) merged cohort of patients, show the most likely sequences of atrophy and their associated uncertainty. In A–C, the y-axis shows the most likely sequence of atrophy progression, and the x-axis shows the sequence position ranging from one to the total number of regions. The intensity of each rectangle corresponds to the proportion of Markov Chain Monte Carlo samples of the posterior distribution where a certain region of y-axis appears at the respective stage of the x-axis. (D) The evolution of the event-based model (EBM) stage (or atrophy progression staging) over time in clinically isolated syndrome and relapse-onset multiple sclerosis together and primary-progressive multiple sclerosis. Each line in D is the prediction of the mixed-effects model whose ribbon shows standard error of the prediction. MS = multiple sclerosis.

