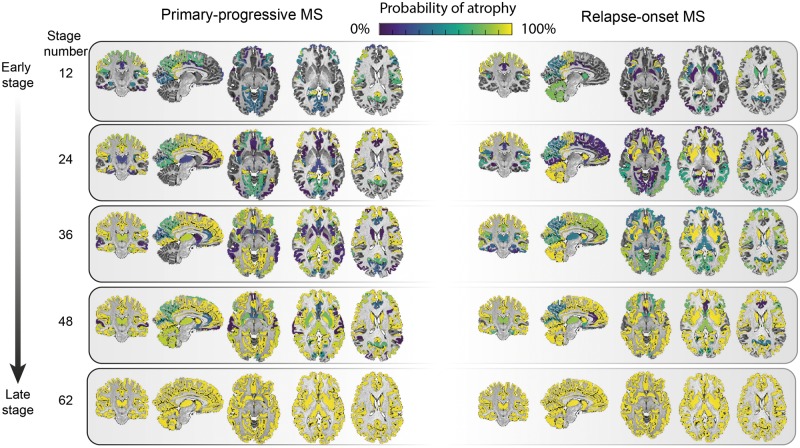
Figure 4.
Regional atrophy and its sequence of progression in all grey matter regions plus brainstem in relapse-onset disease and primary progressive multiple sclerosis. The probability of atrophy in each region was calculated from the positional variance diagrams and colour coded, so that brighter colour corresponded to a higher probability of seeing atrophy in the corresponding event-based model stage. MS = multiple sclerosis.

