Fig. 2.
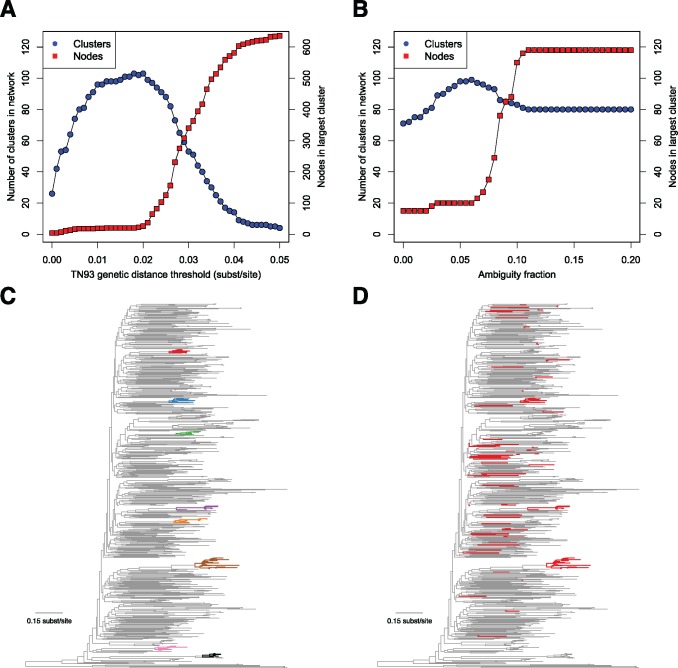
Effect of genetic distance threshold and ambiguity fraction on network construction. (A) Number of clusters and size of largest cluster across increasing genetic distance thresholds. (B) Number of clusters and size of largest cluster across increasing ambiguity fractions. (C) Largest clusters (≥ 7 nodes) from the San Diego Primary Infection Cohort, inferred with a 0.015 substitutions/site genetic distance threshold and a 0.05 ambiguity fraction on a phylogenetic tree (each cluster has its own color and is shown in bold). (D) Members of the large, artifactual cluster when ambiguity fraction is increased to 1.0 and distances from ambiguities in all sequences are resolved (shown in bold, colored in red). San Diego sequence data are from Little et al. (2014), and phylogeny was inferred using FastTree2 (Price et al. 2010 b).

