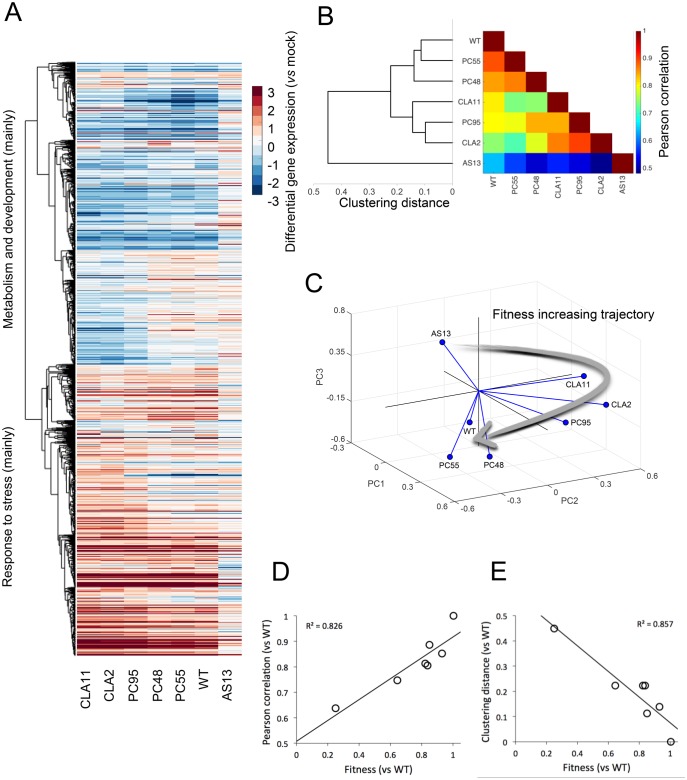
Fig. 2.
Analyses of the transcriptomic data from tobacco plants infected with each TEV genotype. (A) Heat-map representation of gene expression values (infected vs. mock-inoculated control plants) for all viral genotypes. Only genes that show significant differences among all infections (one-way ANOVA with FDR, adjusted P < 0.05) are included in the heat-map. Hierarchical clustering of genes done with UPGMA by using the correlations between all pairs of mean profiles as distance metric. Genes down-regulated (in blue) mainly correspond to metabolic and developmental processes, whereas genes up-regulated (in red) mainly correspond to stress responses. (B) TEV genotypes clustered (UPGMA) according to the similarity of the mean expression profiles of plants infected with each one of them. The heat-map represents the value of the Pearson’s correlation coefficient between pairs of mean profiles. (C) Representation of the three major principal components from the data shown in panel (B). The three first PCs explain up to 93% of the total observed variance. Lines link each genotype with the centroid of the 3D space. The arrow represents a putative trajectory of increasing viral fitness. (D) Association between viral fitness and the magnitude of the perturbation (vs. mock-inoculated control plants) both relative to WT (P = 0.005). (E) Association between viral fitness and the distance of each genotype to the WT (P = 0.003), from the dendrogram shown in panel (B).

